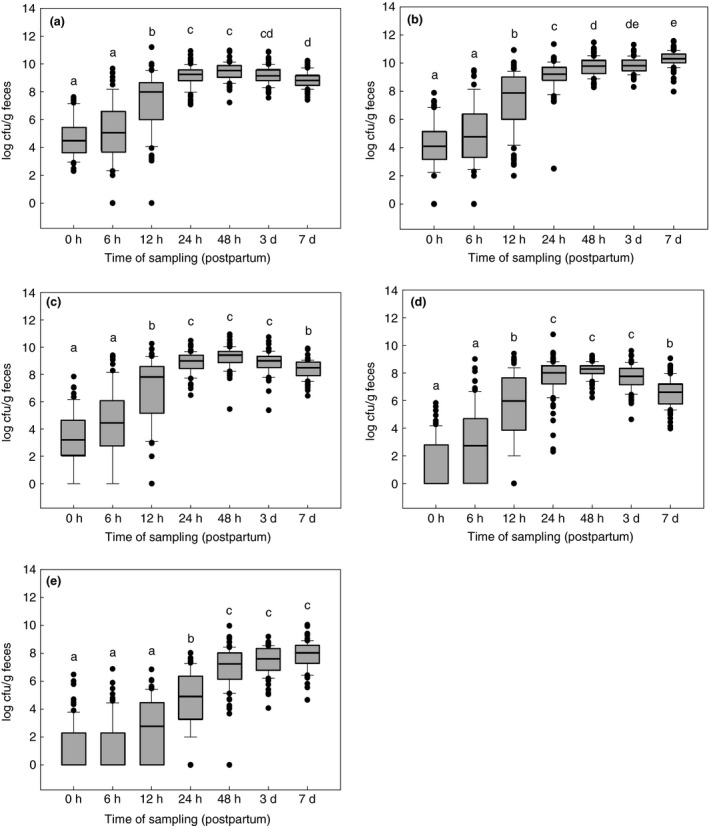
Figure 1.

Development of different groups of bacteria in faeces samples of healthy calves (n = 80) during the first week of life. (a) aerobes; (b) anaerobes; (c) Enterobacteriaceae; (d) enterococci; (e) lactobacilli.  50% of the values,
  median,
  extreme values,
  ,
,  whiskers, a–e different letters indicate significant differences between all times of sampling (anova, Holm–Sidak‐test; P < 0·05). [Colour figure can be viewed at http://wileyonlinelibrary.com]
