
Figure 2.
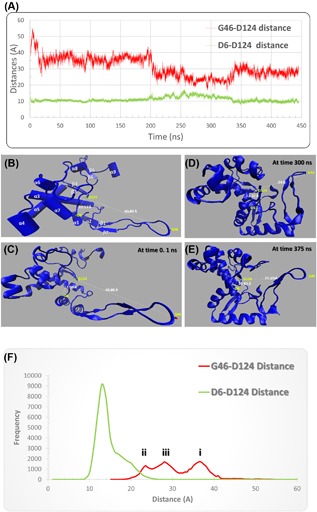
A, Two distances recorded over 444 ns of MDS. G46‐D124 (red line) and D6‐D124 (green line). (B) Secondary structural elements of the ZIKV polymerase model before the MDS run represented in carton using VMD software. (C), (D), and (E) ZIKV polymerase structure at 0.1, 300, and 375 ns, respectively of MDS run showing the differences in the two distances in the different simulation times. (F) Distances distribution showing different patterns as mentioned in the text. The color is the same as in A