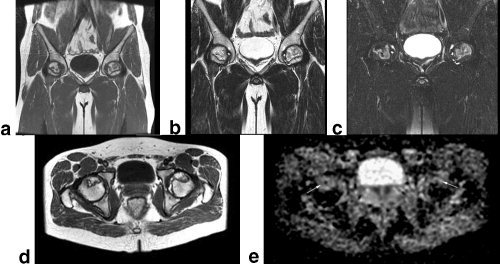
Figure 1.

MR images of the hip of a 28‐year‐old man with SARS. Bilateral femoral head AVN was identified. Coronal T1WI (TR/TE = 460/8.3 msec) (a), coronal T2WI (3400/100) (b), coronal fat‐suppressed STIR (TR/TE = 3420/100 msec) (c), and axial T1WI (TR/TE = 540/8.3 msec) (d) show AVN of the bilateral femoral head. e: Axial ADC map (TR/TE = 4000/76 msec, b = 0, and 1000 seconds/mm2) shows a marked localized increase (arrow) in diffusion.
