
Figure 3.
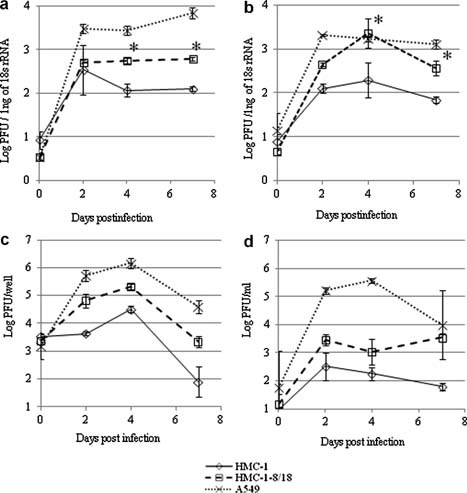
Replication kinetics of RSV genes as detected by real‐time PCR and plaque assay. a and b: Kinetics of the RSV copies upon infection by direct inoculation or spinoculation as detected by real‐time PCR. Cells were inoculated with RSV at an MOI of 1 (a) by direct inoculation or (b) spinoculation at 3,000 rpm for 2 h at 4°C. For spinoculation, the cells were mixed with 500 µl of 10% FCS‐IMDM and added to each well of type I collagen‐coated 24‐well plates (AGC Techno Glass, Chiba, Japan). At the indicated dpi, cells were collected, total RNA was extracted, and first‐strand cDNA was synthesized as described in the legend for Figure 1. Quantitative real‐time PCR was performed with an RSV‐specific primer and probe set. To quantify RSV RNA, a standard curve obtained from serially diluted virus stocks with known PFU values was used. The quantity of RNA was determined from the standard curve and normalized against 18s rRNA values from the same sample. The amount of RSV RNA is presented as the ratio of the log10PFU/1 ng of 18s rRNA (n = 4; P < 0.01). c and d: Kinetics of the infectious RSV titer upon infection by spinoculation as detected by plaque assay. Cells were inoculated with RSV at an MOI of 1 by spinoculation at 3,000 rpm for 2 h at 4°C. At the indicated dpi, (c) the cells and (d) supernatants were collected separately, and the RSV titer was determined by plaque assay using HEp‐2 cells. The titers are presented as the (c) log10PFU/well and (d) log10PFU/ml (n = 6).