
Figure 2.
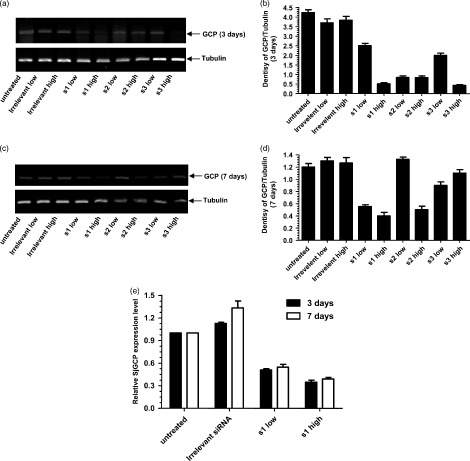
Effect of in vitro RNAi on SjGCP at the transcript level. (a) Semi‐Q RT‐PCR analysis at 3 days post‐treatment. (b) Image from (a) analyzed by Smartview software. Each value in the column is the ratio of the optical density of SjGCP and beta tubulin. (c) Semi‐Q RT‐PCR analysis of at 7 days post‐treatment. (d) Image from (c) analyzed by Smartview software. (e) Real‐time RT‐PCR analysis of SjGCP s1 siRNA at 3 and 7 days post‐treatment. Data are expressed as the mean ± SD of triplicate experiments