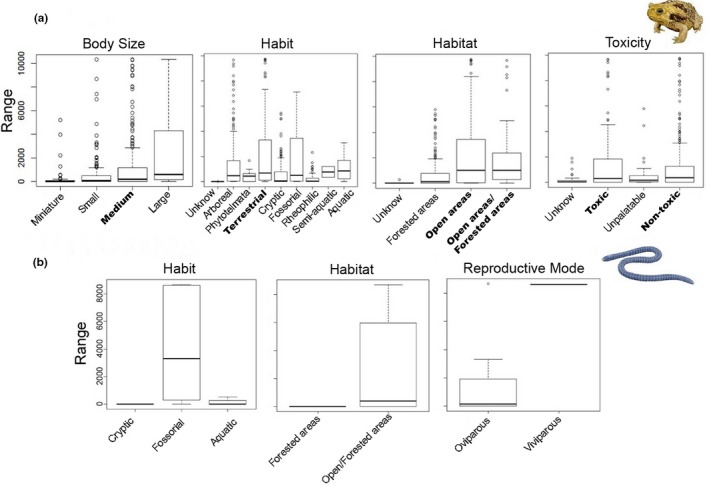
Figure 4.

Boxplots showing the functional traits that better explain the spatial ranges (measure number cells of 10 km2) for (a) Anura and (b) Gymnophiona in the Brazilian Atlantic Forest. Bold indicate the functional subtraits that better explained the spatial ranges of species [Colour figure can be viewed at http://wileyonlinelibrary.com]
