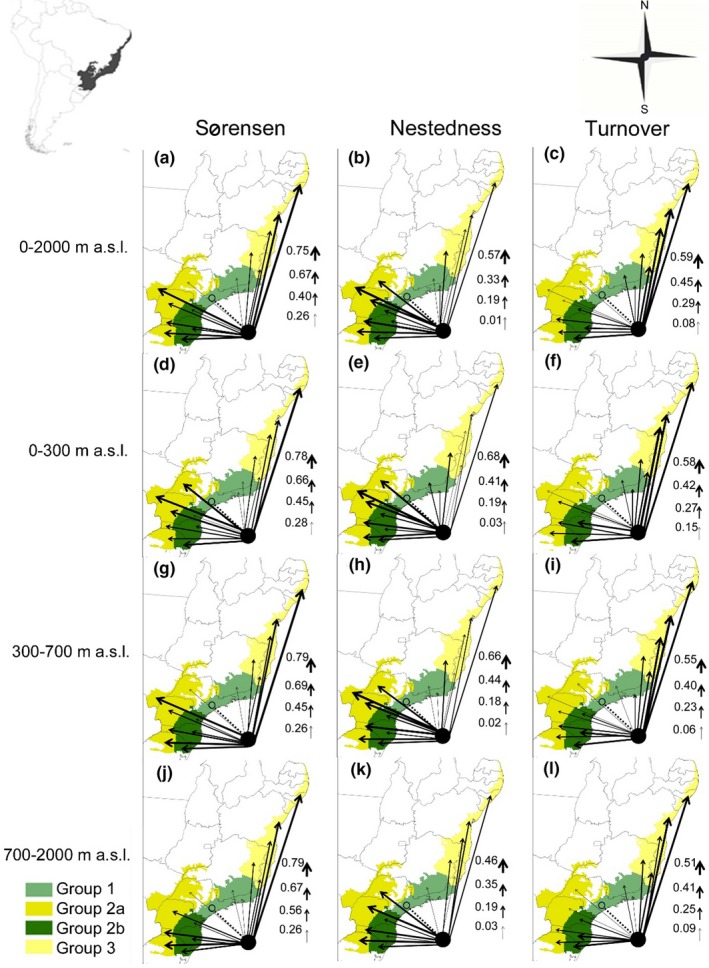
Figure 5.

Relative partitioning of amphibian beta diversity across the groups of study sites assessed in the Brazilian Atlantic Forest. Thinner arrows indicate smaller values, thicker arrows larger values. Beta diversity values are shown from the large biota ESP (circle) to the subsets. (a–c) beta diversity values with all altitude variations (0–2000 m), (d–e) beta diversity values with 0–300 m altitude variations, (g–i) beta diversity values with 300–700 m altitude variations, and (j–l) beta diversity values with 700–2000 m altitude variations [Colour figure can be viewed at http://wileyonlinelibrary.com]
