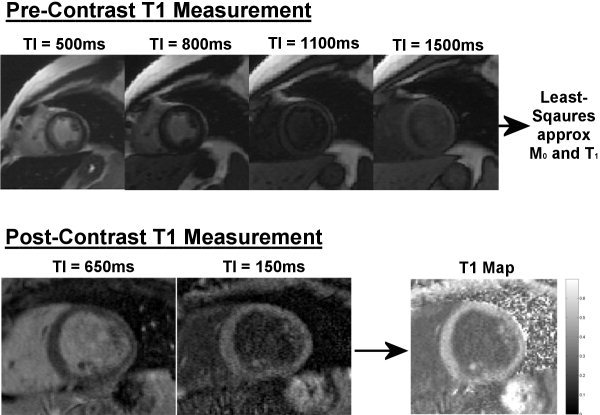
Figure 1.

Top: Precontrast T1 measurement of one subject using four separate IRss images at selected TIs. In vivo T1 was estimated using ROIs and a least‐squares approximation to Eq. [3]. Bottom: T1 calculation from a subject 15 minutes postinjection (0.2 mmol/kg) at 1.5T. The ratio method for calculating T1 involves two IR images using two different TIs: TIhigh = 650 msec and TIlow = 150 msec. The images were rescaled and then divided (TIhigh/TIlow) to produce an intensity‐ratio map. A T1 map was numerically calculated on a pixelwise basis using Eq. [4], assuming an appropriate T1 value.
