
Figure 2.
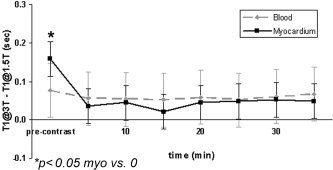
The plot compares pre‐ and postcontrast T1 differences between 1.5T and 3T (T1@3T – T1@1.5T) for all 10 subjects (combined 0.1 mmol/kg and 0.2 mmol/kg). The T1 difference between 1.5T and 3T decreases following contrast injection, and the decrease is more significant for myocardium than blood. Following contrast injection, the T1 difference remains relatively constant over time and is insensitive to dose and tissue type. Ten minutes postinjection the T1 difference decreased 72% for myocardium and 30% for blood. Although there was significant variability in T1 among subjects, the relaxation times at 3T were still generally greater than 1.5T.