
Figure 4.
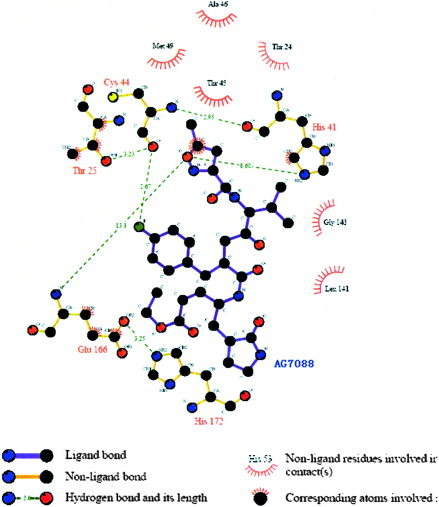
Schematic representation of the SARS–AG7088 interactions. [Color figure can be viewed in the online issue, which is available at www.interscience.wiley.com.]
Official websites use .gov
A
.gov website belongs to an official
government organization in the United States.
Secure .gov websites use HTTPS
A lock (
) or https:// means you've safely
connected to the .gov website. Share sensitive
information only on official, secure websites.
Schematic representation of the SARS–AG7088 interactions. [Color figure can be viewed in the online issue, which is available at www.interscience.wiley.com.]