
Figure 2.
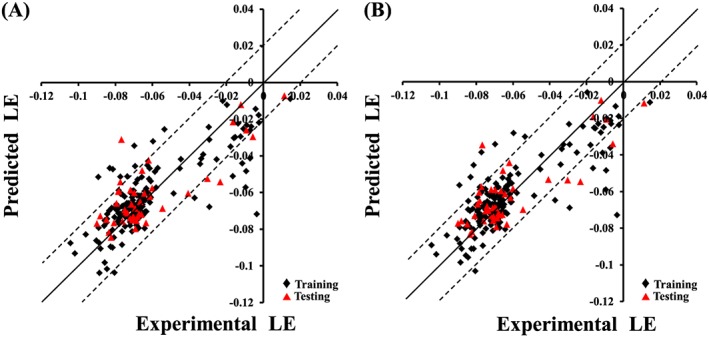
Experimental versus predicted bioactivities for the training and testing compounds. Predicted bioactivities calculated using the best QSAR models: (A) Equation (3) and (B) Equation (4). The solid line is the regression line for the fitted and predicted bioactivities of training and test compounds, respectively, whereas the dotted lines indicate arbitrary error margins.