
Figure 6.
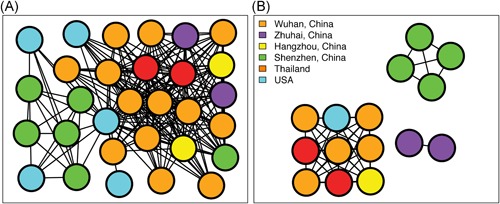
Transmission clusters of 2019‐nCOV. Structure of inferred 2019‐nCOV transmission clusters from full dataset (“dataset_32”) using genetic distances of less than 0.01% and less than 0.001% substitutions/site are illustrated in (A) and (B), respectively. Nodes (circles) represent connected individuals in the overall network, and putative transmission linkages are represented by edges (lines). Nodes are color‐coded by sampling locations