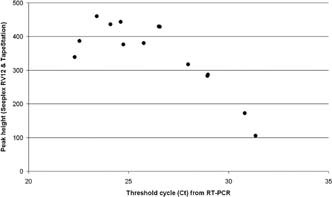
Figure 2.

Plot showing how peak heights obtained using Seeplex® RV12 and the TapeStation microelectrophoresis platform display negative correlation with the threshold cycles obtained from the RT‐PCR method. Data shown are from influenza A‐positive samples.
