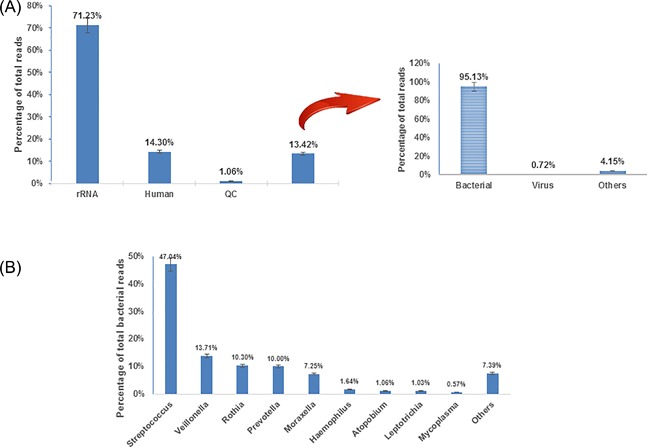
Figure 1.

The distribution of sequencing reads from clinical specimens. A, The taxonomic distribution of total sequencing reads. B, The distribution of bacterial content sequencing reads from clinical specimens. Data are average values from 50 nasopharyngeal specimens
