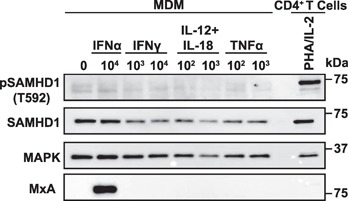
Figure 6.

Impact of cytokine stimulation on SAMHD1 expression and phosphorylation in MDMs. Immunoblot analysis of MDM after 24 h of treatment with indicated concentrations of different cytokines (ng/ml for IL‐12/IL‐18/TNF‐α and IU/ml for IFN‐α/IFN‐γ). Cells were lysed and analyzed with anti‐pSAMHD1(T592)) and anti‐pan‐SAMHD1 antibodies. Activated CD4+ T cells served as positive control for pSAMHD1(T592) detection. MxA served as a positive control for IFN‐induced gene expression and MAPK as a loading control. Shown is 1 representative donor out of 7.
