
Figure 3.
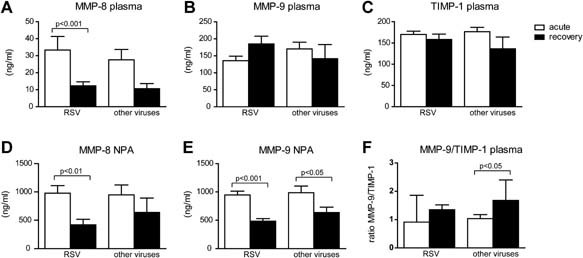
MMP‐8 and MMP‐9 concentrations in plasma and nasopharyngeal samples from children during acute lower respiratory tract infections and after recovery. Plasma concentration of MMP‐8 (A), MMP‐9 (B), TIMP‐1 (C), and concentration in nasopharyngeal washes of MMP‐8 (D) and MMP‐9 (E) from children during acute RSV positive and RSV negative viral lower respiratory tract infections and after recovery of infection. Ratio's between plasma MMP‐9 and TIMP‐1 (F). Concentrations (ng/ml) are given in mean ± standard error. Mann–Whitney U‐test was performed to compare children infected by RSV and other viruses. Paired analyses (Wilcoxon) were performed to compare acute and recovery samples. A two‐sided value of P < 0.05 was considered statistically significant.