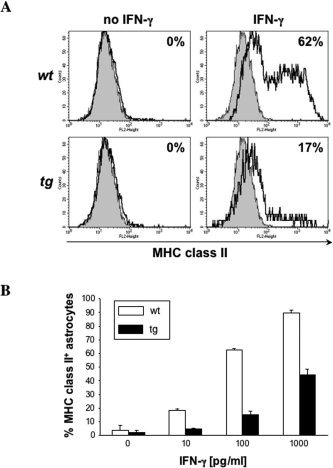
Figure 5.

Impaired IFN‐γ signaling in astrocytes from the GFAPγR1Δ mice. IFN‐γ‐dependent MHC class II expression analyzed by flow cytometry (A). Mixed glial cell cultures derived from wt (top) and tg (bottom) mice incubated in the absence (left) or presence (right) of 100 pg/ml IFN‐γ for 48 hr. Histograms are gated on CD45− astrocytes. The gray area represents isotype control and the bold line MHC class II‐specific staining. Numbers indicate percentage of MHC class II+ cells within the astroglial cell population. B: Percentage of class II‐positive astrocytes after 48 hr incubation at various IFN‐γ concentrations. Data represent average results of two separate experiments. Error bars represent standard deviation.
