
Figure 6.
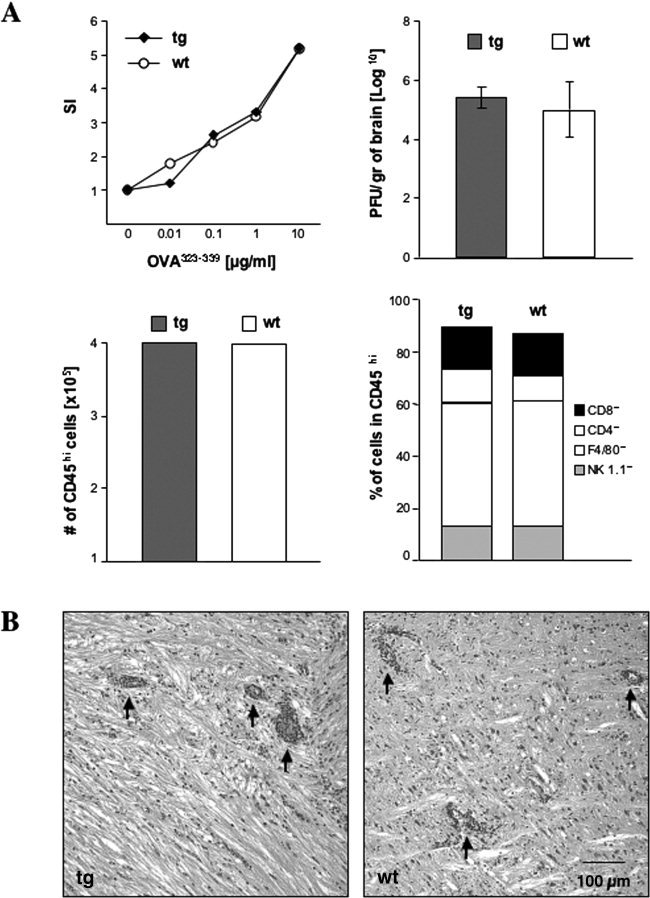
Immune responses in wt and tg mice. A: Antigen‐specific T cell proliferation from OVA323–339‐immunized GFAPγR1Δ tg (diamonds) and C57BL/6 wt (circles) mice. SI, stimulation index. CNS virus titers (average of three individual mice) at day 7 p.i. in GFAPγR1Δ tg (solid bars) and wt (open bars) mice. Error bars represent standard deviation. CNS infiltrating CD45hi cell numbers in GFAPγR1Δ tg (solid bars) and wt (open bars) mice at day 7 p.i. Composition of CNS‐infiltrating cells at day 7 p.i. in GFAPγR1Δ tg and wt mice. T cell proliferation and CNS‐infiltrating cells were analyzed in pooled cell populations from three individual mice. All data shown are representative of three separate experiments. B: CNS inflammation in GFAPγR1Δ tg (left) and wt (right) mice at day 7 p.i. Sections of midupper brainstem stained with hematoxylin and eosin. Arrows indicate perivascular inflammation.