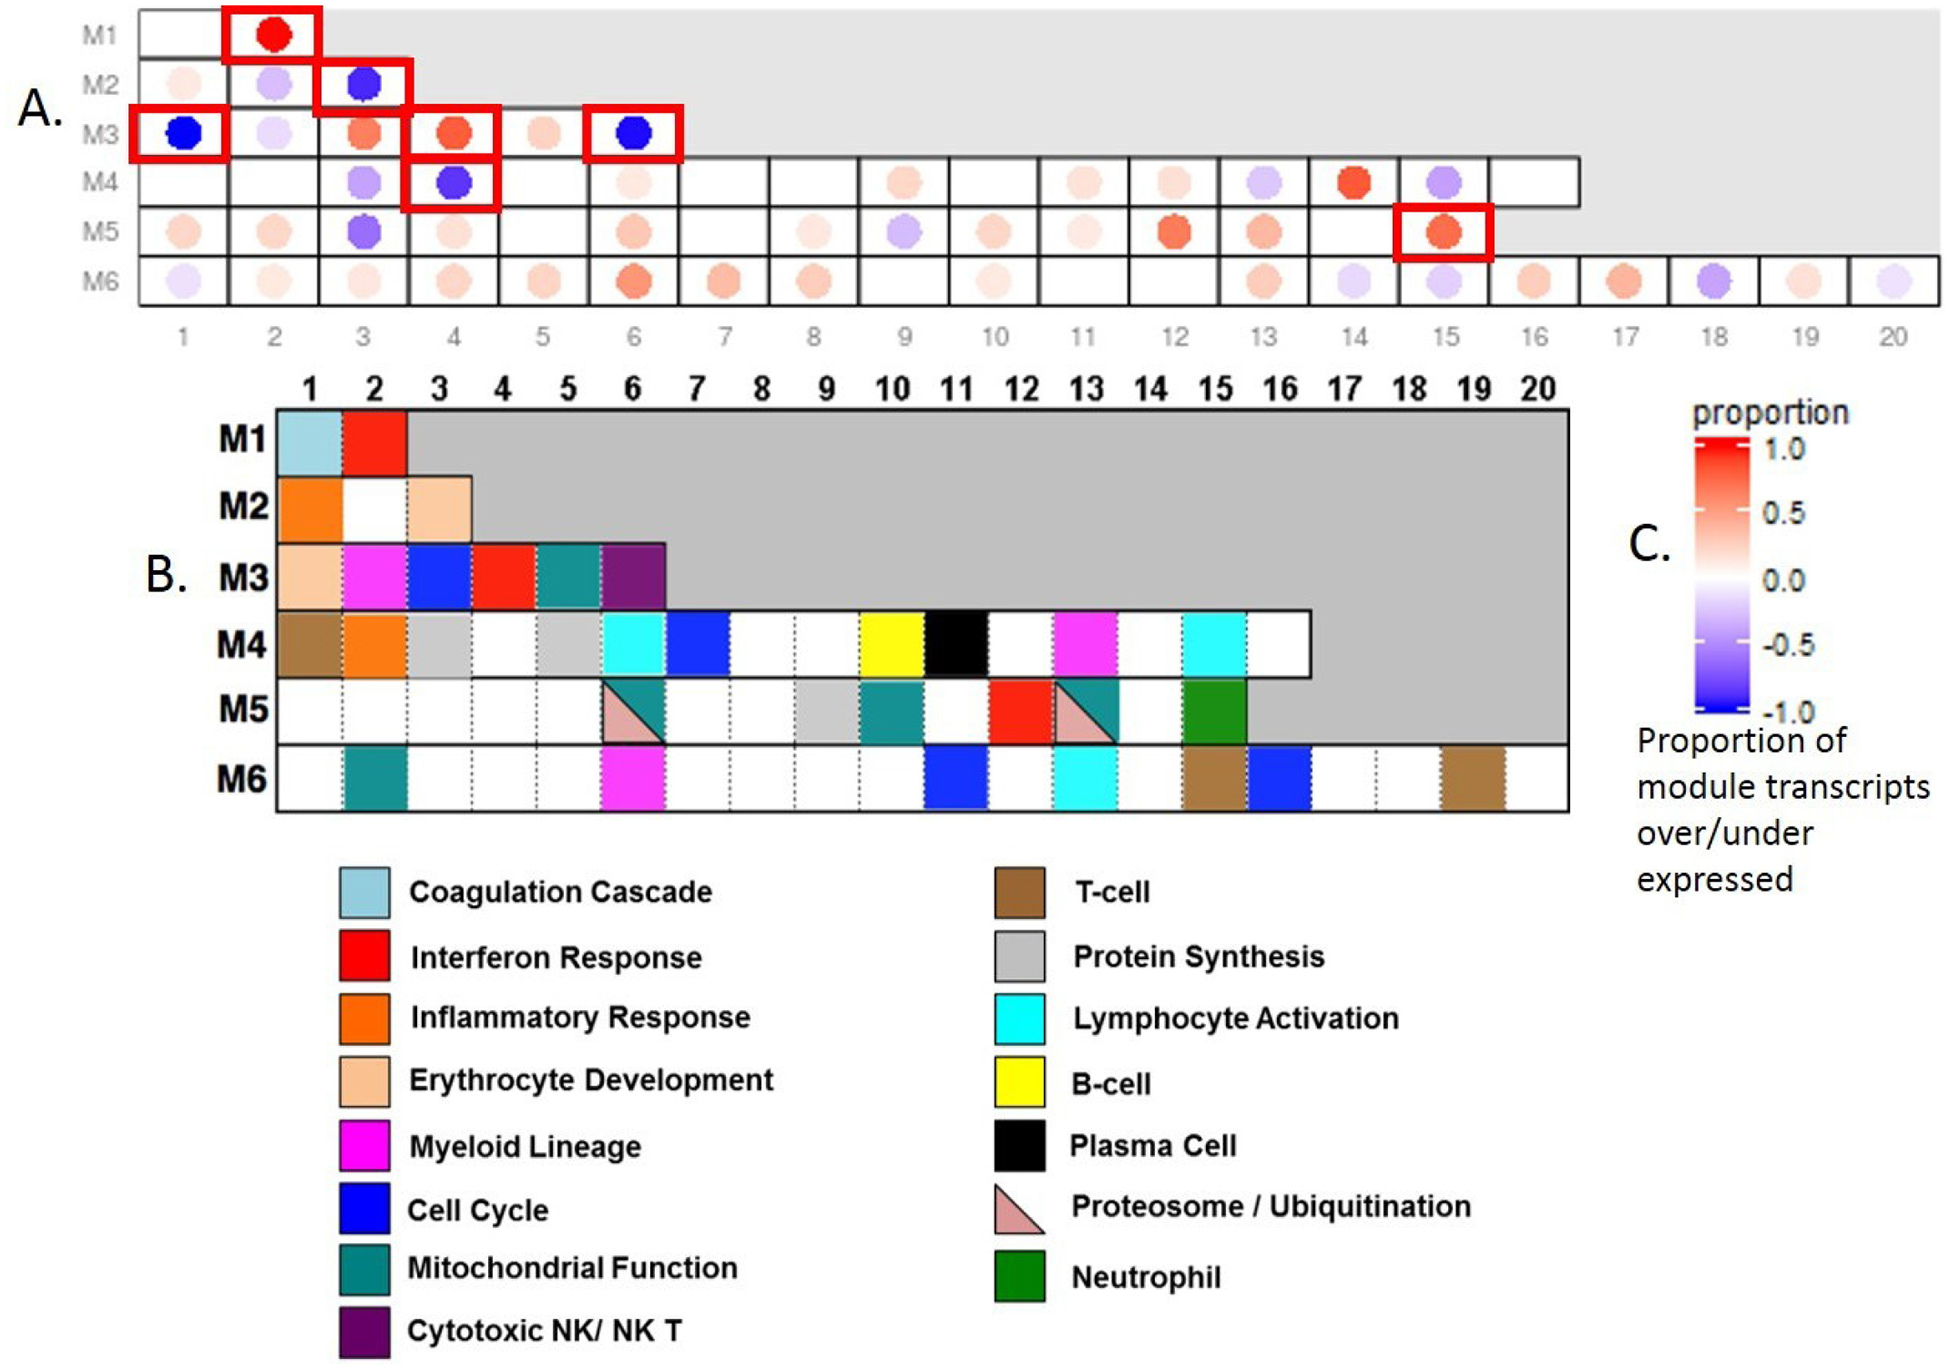
Figure 1.

(A) Modular analysis of baseline SSc in comparison to unaffected control samples. The numbers on the x-axis and y-axis indicate the coordinates of modules; (B) Annotation of modules based on known biological function of genes included in a given module; (C) Legend for the colour coding in A. Significantly differentially expressed modules in QuSAGE analysis are shown with red perimeters. A significant upregulation of interferon (M1.2, M 3.4) and neutrophil (M5.15) modules were observed while erythrocyte and cytotoxic NK/ NK T (M3.6) modules were significantly downregulated.
