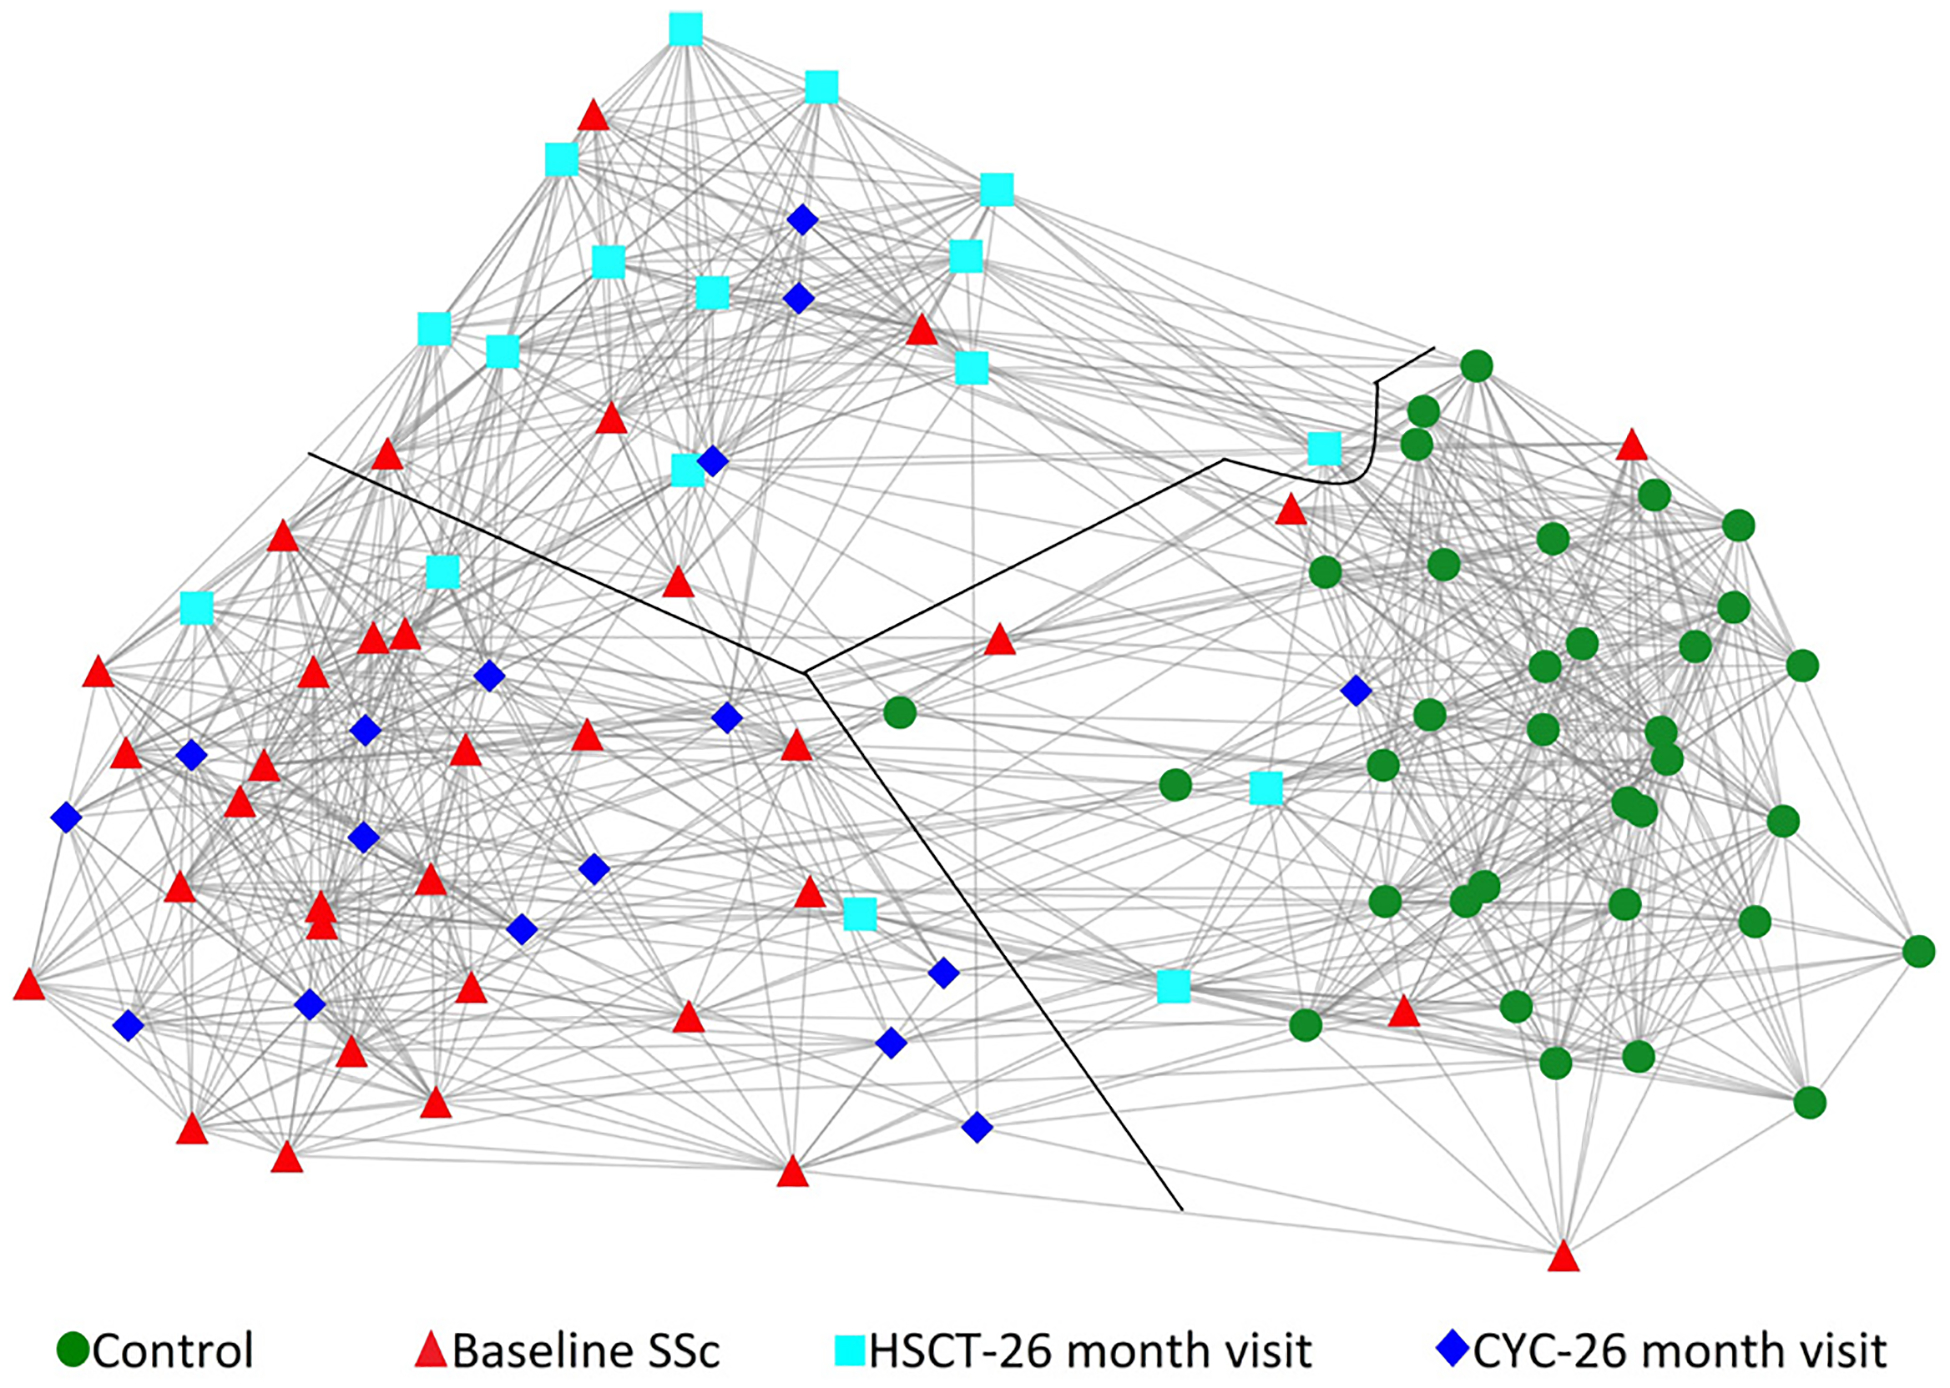
Figure 4.

Similarity network fusion analysis of global gene expression and all available serum protein data from matched controls (circle-green, n=34), baseline SSc (triangle-red, n=34), HSCT—26 months visit (square-light blue, n=17) and CYC—26 months visit (diamond-dark blue, n=17) samples. Each shape represents a unique sample. Three distinct networks clusters were present, which are divided by the black line. The majority of baseline SSc and CYC 26 months visit samples formed a distinct network cluster while majority of HSCT 26 months visit samples formed a separate network cluster (middle). Moreover, all unaffected controls clustered separately. Of note, this is a two-dimensional display of a three-dimensional space. CYC, cyclophosphamide; HSCT, haematopoietic stem cell transplantation; SSc, systemic sclerosis.
