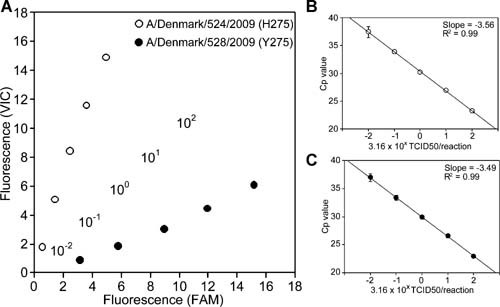
Figure 1.

A: Endpoint fluorescence plot. Serial dilutions of A/Denmark/524/2009 (open circle) and A/Denmark/528/2009 (filled circle) were analyzed by H275Y RT‐PCR assay. Viral titers of these two isolates were 3.16 × 10², 3.16 × 101, 3.16 × 100, 3.16 × 10⁻¹, and 3.16 × 10⁻² TCID50/reaction and are represented in the centerline of the plot as 102, 101, 100, 10−1, and 10−2, respectively. The plot was generated using the average of the results obtained from the assay performed in six replicates. Relative H275 (VIC) and Y275 (FAM) fluorescence are plotted on the y‐axis and x‐axis, respectively. B,C: Serial dilutions of A/Denmark/524/2009 (B) and A/Denmark/528/2009 (C) were analyzed by Type A rRT‐PCR assay. The standard curves were generated using average crossing point (Cp) values obtained from the assay performed in six replicates. The correlation coefficient and slope of the standard curve are represented in the graphs.
