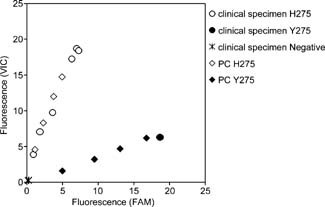
Figure 2.

Endpoint fluorescence plot of H275Y RT‐PCR assay using clinical specimens. Relative H275 (VIC) and Y275 (FAM) fluorescence are plotted on the y‐axis and x‐axis, respectively. Clinical specimens discriminated as H275 or Y275 are represented as open circles or filled circles, respectively. Viral titers of 3.16 × 101, 3.16 × 100, 3.16 × 10⁻¹, and 3.16 × 10⁻² TCID50/reaction of A/Denmark/524/2009 (PC H275, open diamond) and A/Denmark/528/2009 (PC Y275, filled diamond) were used as positive controls for the assay.
