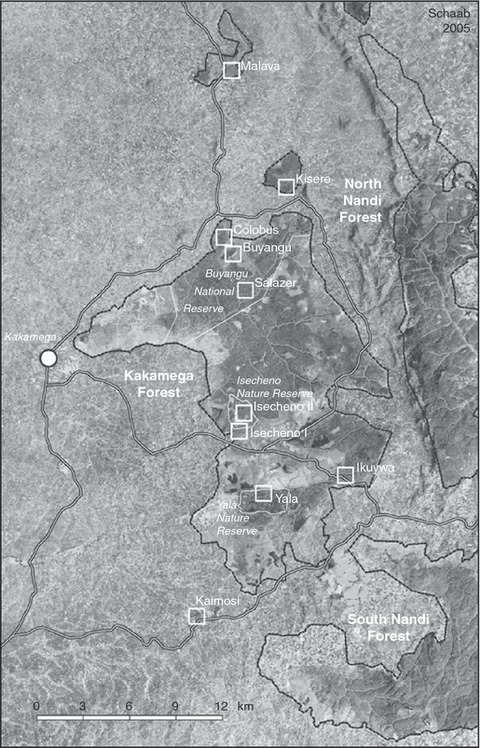
Figure 1.

Map of the main study areas investigated by the BIOTA East Africa project in the Kakamega Forest with a subset of a Landsat 7 (ETM+) scene from 5 February 2001 in the background. (Contrast‐enhanced band combination 5/4/3 for within‐forest differentiation but printed in black and white. Squares show BIOTA East Africa research plots; forest borders are marked with a dashed black line; within these markings, darker shadings show the primary‐like forest, lighter shadings disturbed areas and younger secondary forest. Courtesy of G. Schaab, BIOTA‐E02.)
