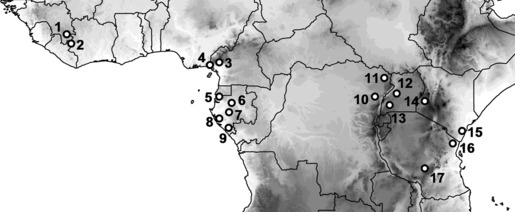
Figure 2.

Map showing the rain forest localities used in the diversity coefficient analysis. The number of reptile species that the other forests have in common with Kakamega Forest is provided in bold below, followed by coefficient of biogeographic relationships in parentheses. Increasing elevation is shown by light to dark shading. Country borders are shown. 1 = ZIA, Ziama Forest, Guinea (15; 0.26); 2 = MTN, Mt Nimba, Guinea (14; 0.22); 3 = KOR, Korup NP, Cameroon (18; 0.27); 4 = MNL, Mt Nlonako, Cameroon (21; 0.29); 5 = MCR, Monts de Crystal, Gabon (13; 0.25); 6 = LOP, Lopé NP, Gabon (14; 0.31); 7 = MAC, Massif du Chaillu, Gabon (11; 0.22); 8 = LOA, Loango NP, Gabon (9; 0.20); 9 = MOK, Moukalaba‐Doudou NP, Gabon (11; 0.22); 10 = VIR, Virunga Mountains, DR Congo (37; 0.44); 11 = GAR, Garamba NP, DR Congo (25; 0.38); 12 = KIB, Kibale Forest, Uganda (28; 0.54); 13 = BWI, Bwindi Impenetrable Forest, Uganda (18; 0.39); 14 = KMF, Kakamega Forest, Kenya; 15 = ARA, Arabuko‐Sokoke Forest, Kenya (9; 0.15); 16 = USA, Usambara Mountains, Tanzania (5; 0.12); 17 = UZU, Udzungwa Mountains, Tanzania (0; 0.0).
