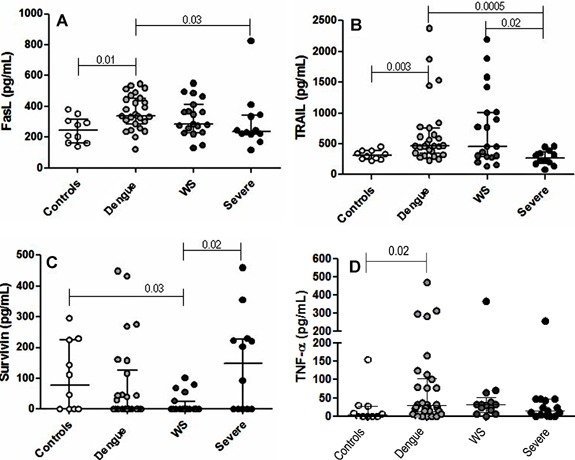
Figure 1.

Plasma levels of TNF‐related apoptosis‐inducing ligand or TRAIL (A), Fas ligand or FasL (B), Survivin (C), and TNF‐α (D) in Controls (solid white) and patients classified as dengue without warning signs or dengue (solid bright gray), dengue with warning signs or WS (solid dark gray), and severe dengue or Severe (solid black). The Mann–Whitney test was used for statistical analysis by means of GraphPad Prism v5.0 program. Horizontal lines represent the median and the vertical lines correspond to the interquartile variation (25–75%). P‐value indicates the statistical significance.
