Figure 1.

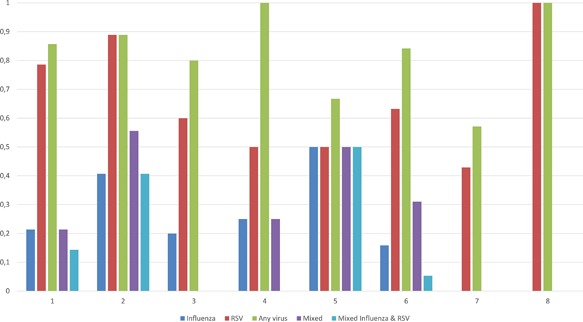
Variability of virus detection per collected samples (in %, one equals 100%) during the 2010‐11 season per week of study

Variability of virus detection per collected samples (in %, one equals 100%) during the 2010‐11 season per week of study