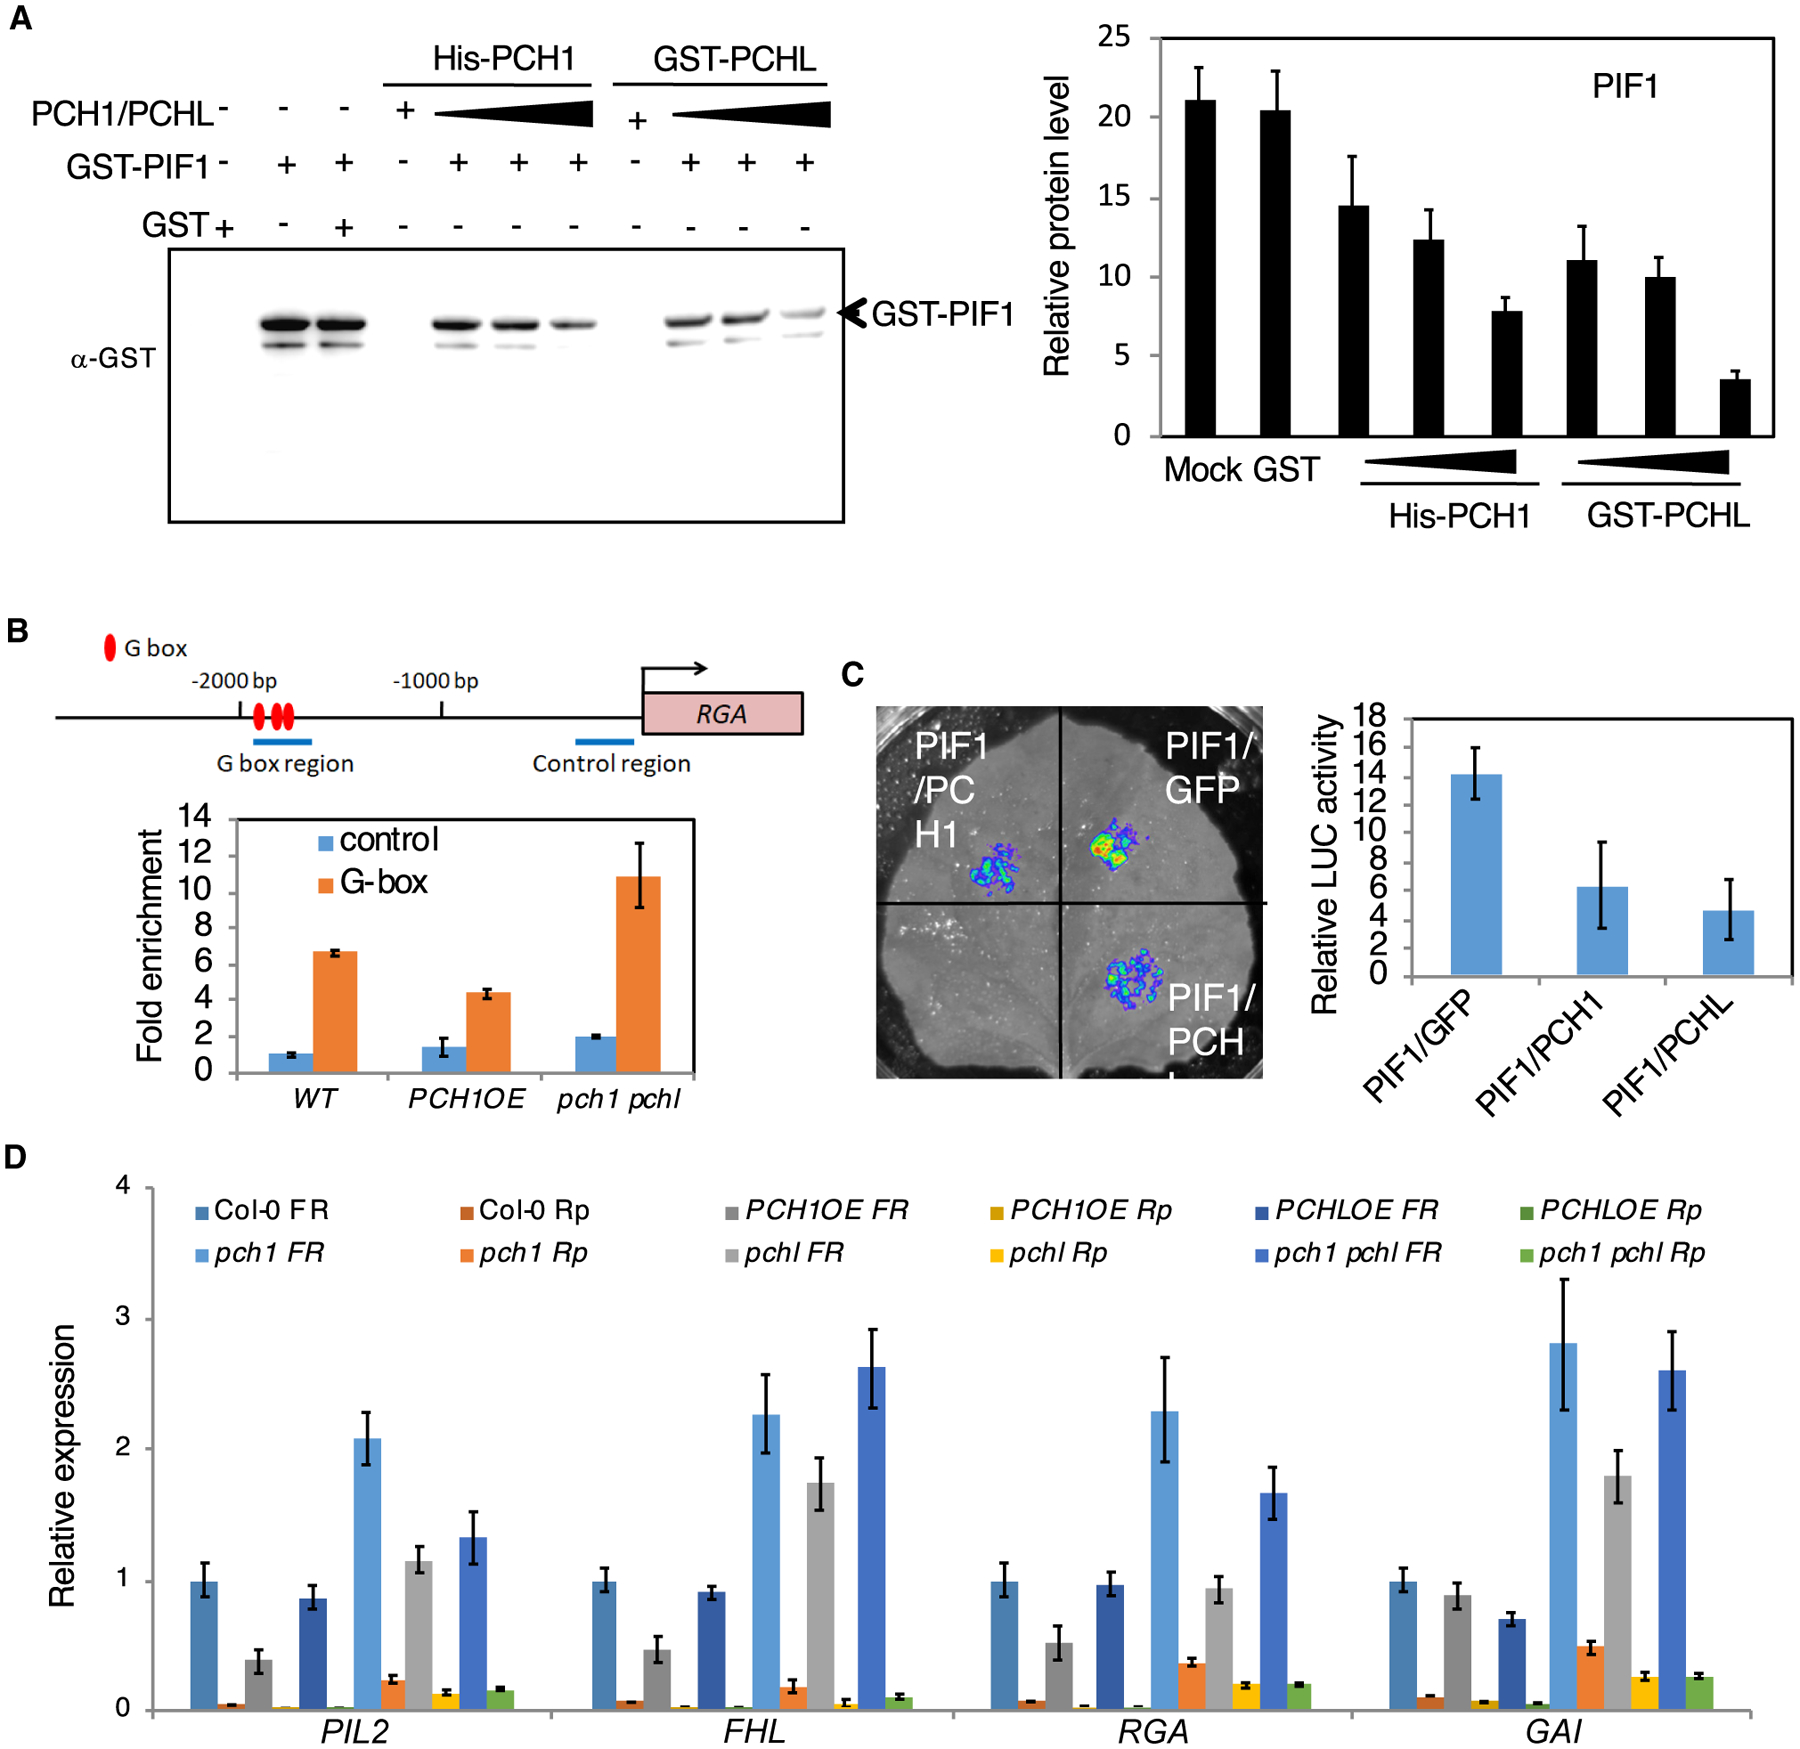
Figure 4. PCH1 and PCHL Impaire the DNA-Binding and Transcriptional Activity of PIF1.

(A) DNA-IP assay. Left: PIF1 immunoprecipitated by PIL1 promoter fragment is gradually reduced when adding increasing amounts of PCH1 and PCHL. Three biological repeats were performed with similar results. Right: quantitative results of the left figure. Error bars represent SE (n = 5 biological repeats).
(B) Chromatin immunoprecipitation (ChIP) assays show PIF1 binding to the G-box motif of PIF1 target promoters. The ChIP assay was performed using wild-type, PCH1OE, and pch1 pchl mutant seeds exposed to 5 min of far-red light (3.2 μmol m−2s−1) and kept in the dark for 6 h as described by Oh et al. (2007). Anti-PIF1 antibodies were used to immunoprecipitate native PIF1 and associated DNA fragment. DNA was amplified using primers specific to the G-box fragments or control regions in RGA promoters as indicated by the arrows in the promoter structure above as designed by Oh et al. (2007). Error bars represent SE (n = 3 biological repeats).
(C) Transient transcriptional activity assay. Four-week-old tobacco plants were transiently transformed with the different combinations of constructs indicated below. Relative expression of LUC activity was observed and measured. The data were normalized by protein concentration. Error bars represent SE (n = 6 biological repeats).
(D) The expression of PIF1 target genes is decreased in PCH1 and PCHL overexpression lines and increased in pch1 and pchl mutants compared with wild-type seeds under far-red (FR) and red pulse (Rp) light. Bar graph shows expression of various PIF1 target genes in the indicated genotypes in far-red and red light. Error bars indicate SEM (n = 3 biological repeats).
