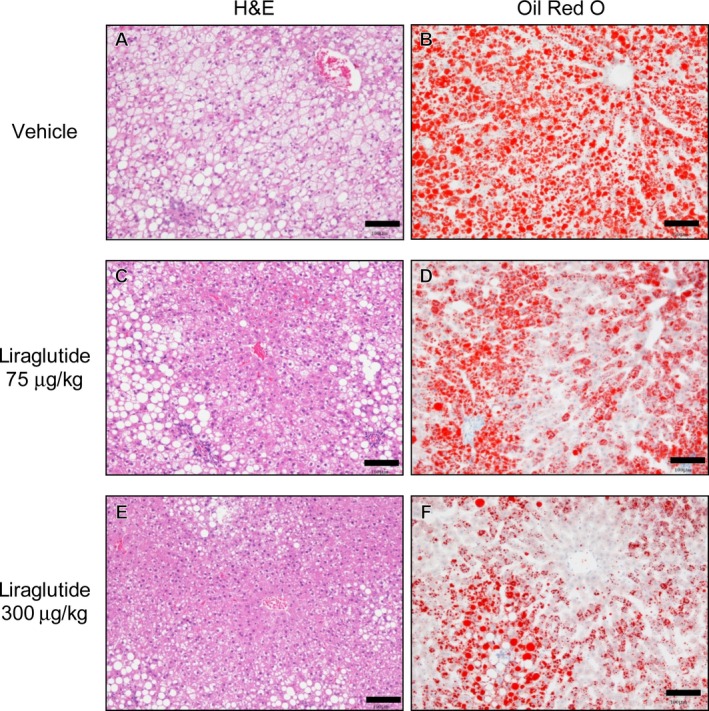
FIGURE 6.

Representative H&E staining and Oil Red O staining of liver sections. H&E staining (A, C, E) and Oil Red O staining (B, D, F) of liver sections from high‐fat diet‐supplemented WBN/Kob‐Leprfa rats at the end of the experimental period was performed (Scale bar = 100 µm). These rats were treated with a vehicle (A and B), low‐dose (75 μg/kg, C and D), or high‐dose (300 μg/kg, E and F) liraglutide for 4 wk
