FIGURE 1.

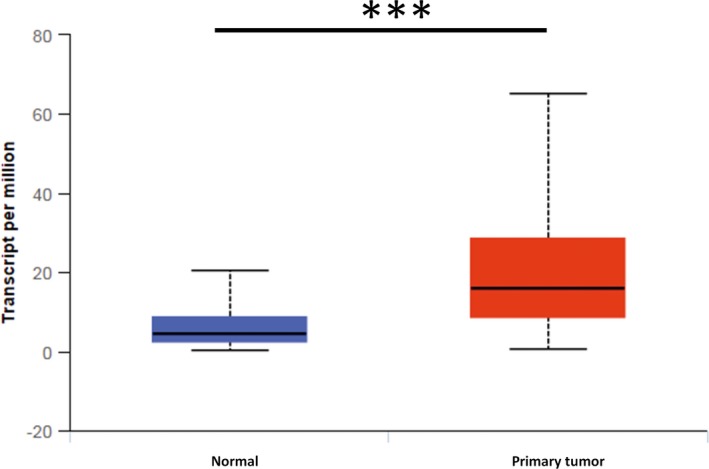
OGR1 is overexpressed in primary HNSC. Compared with the expression in normal tissues (n = 44), the expression of OGR1 in primary HNSC tissues (n = 520) is significantly higher (***P < .001)

OGR1 is overexpressed in primary HNSC. Compared with the expression in normal tissues (n = 44), the expression of OGR1 in primary HNSC tissues (n = 520) is significantly higher (***P < .001)