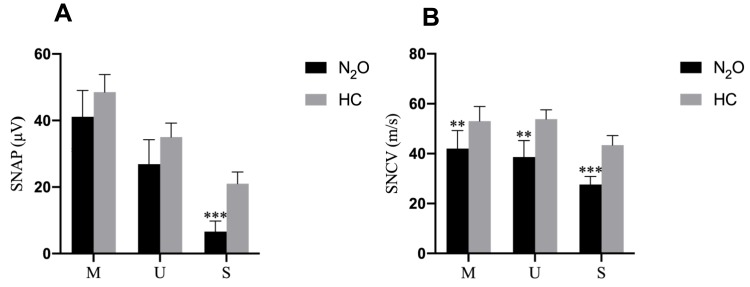
Figure 2.
Sensory nerve conduction study results in the health control (HC) and N2O-abuse groups. (A) The sensory nerve action potential amplitude and (B) sensory conduction velocity of each sensory nerve for the HC (gray bar) and N2O-abuse (black bar) groups.
Notes: Data are presented as mean ± standard error of the mean. Significant differences are indicated by **p < 0.01; ***p < 0.001.
Abbreviations: M, median nerve; U, ulnar nerve; S, sural nerve.

