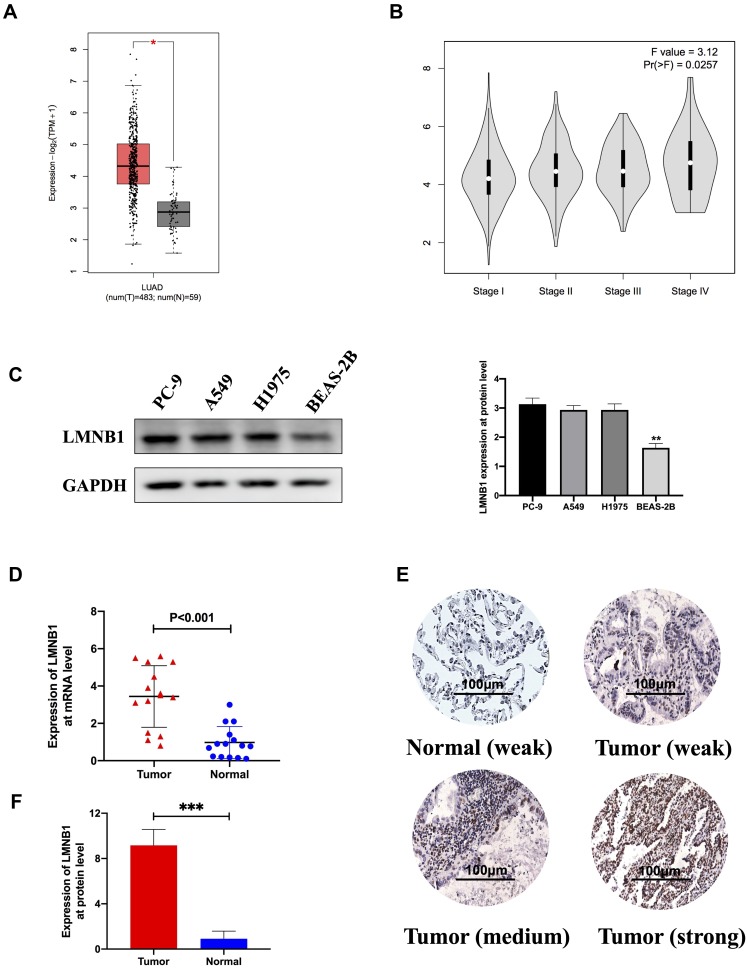
Figure 1.
LMNB1 was upregulated in LUAD tissues compared with paracancerous tissues (A) The expression of LMNB1 at mRNA level in LUAD patients from TCGA dataset by using bioinformatics’ analyses (* means differentially expressed genes). (B) The expression of LMNB1 in the different pathological stage of LUAD patients from TCGA dataset by using bioinformatics’ analyses. (C) Expression of LMNB1 in LUAD cell lines and human bronchial epithelial cells line by using Western blot. The histogram is a semi-quantitative analysis of Western blot data (**P<0.01). (D) The expression of LMNB1 at mRNA level in LUAD patients by qPCR. (E) Representative IHC staining images of LMNB1 in LUAD tissues and normal lung tissues. (F) Chart of expression of LMNB1 by using IHC and the associated statistics (***P<0.001).

