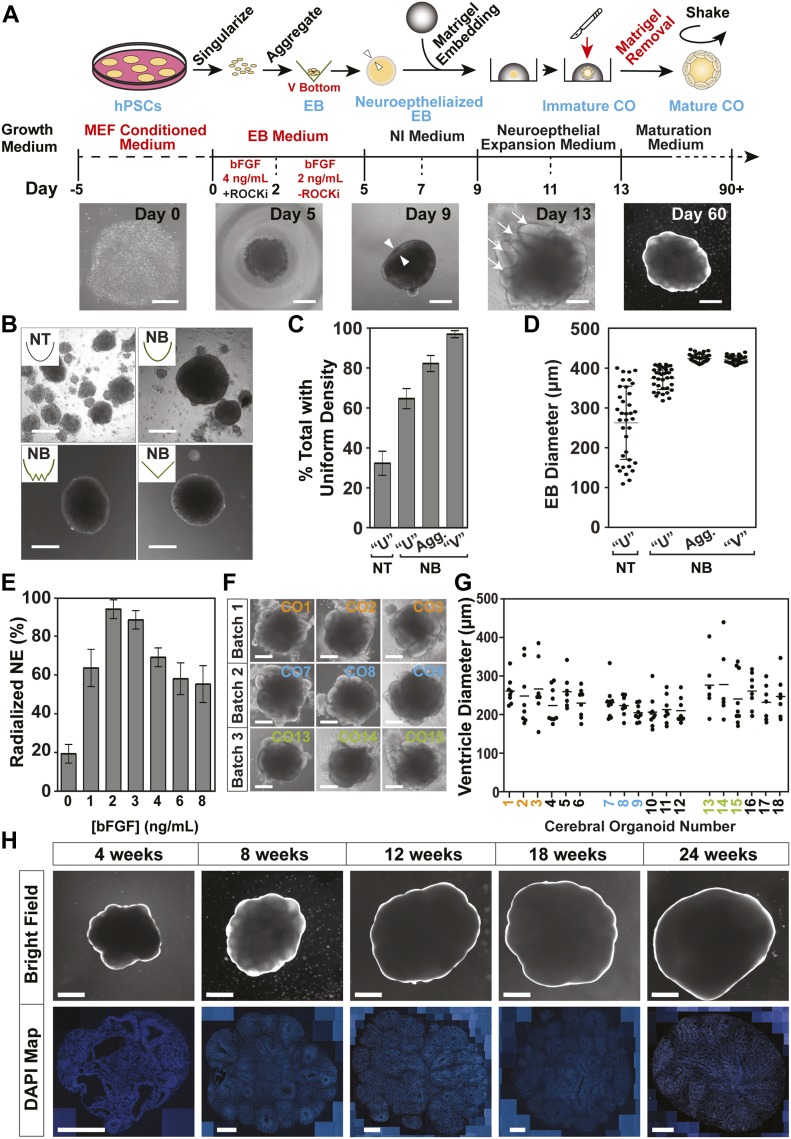
Figure 1. Generation of hCOs from H9 ESCs.
(A) A schematic depicting the main steps for human cerebral organoid (hCO) production. Representative bright-field images of morphological changes are shown below. Triangles (Day 9) mark the inner and outer edge of the neuroepithelial ring, and arrows (Day 13) indicate early ventricle structures. Scale bars: 250 μm for days 0, 5, 9, and 13 and 1 mm for Day 60. (B, C, D) The effect of well shape and surface coating on embryoid body (EB) formation was assessed on Day 5. (B) Representative bright-field images of EBs generated using the indicated plate format. Scale bar = 250 μm. Non-treated (NT), nonbinding (NB). (C) Percent of cell aggregates displaying uniform density as assessed using phase-contrast microscopy is plotted as the mean ± SD (n = 3). (D) Individual EB diameters (black circles) and the mean (horizontal dash) ± SD (n ≥ 30/condition) is plotted. (E) Percent of total EBs displaying radialization neuroepithelium on Day 5 at the indicated bFGF concentrations are plotted as mean ± SD (n = 3). (F, G) Analysis of ventricle formation on Day 13. (F) Representative bright-field images of COs before Matrigel extraction from three independent batches are shown. Scale bar = 500 μm. (G) Quantification of the diameter of individual ventricle-like structures (black circles) from three independent batches is plotted with the mean diameter marked (horizontal dash). (F) Colored numbering corresponds to images in panel (F). (H) Macroscopic organization in H9-derived hCOs. Representative bright-field (Scale bar = 1 mm) images of hCOs in suspension culture at 4, 8, 12, 18, and 24 wk of culture (top) with corresponding sections stained with DAPI to mark nuclei (bottom). Scale bar = 500 μm.

