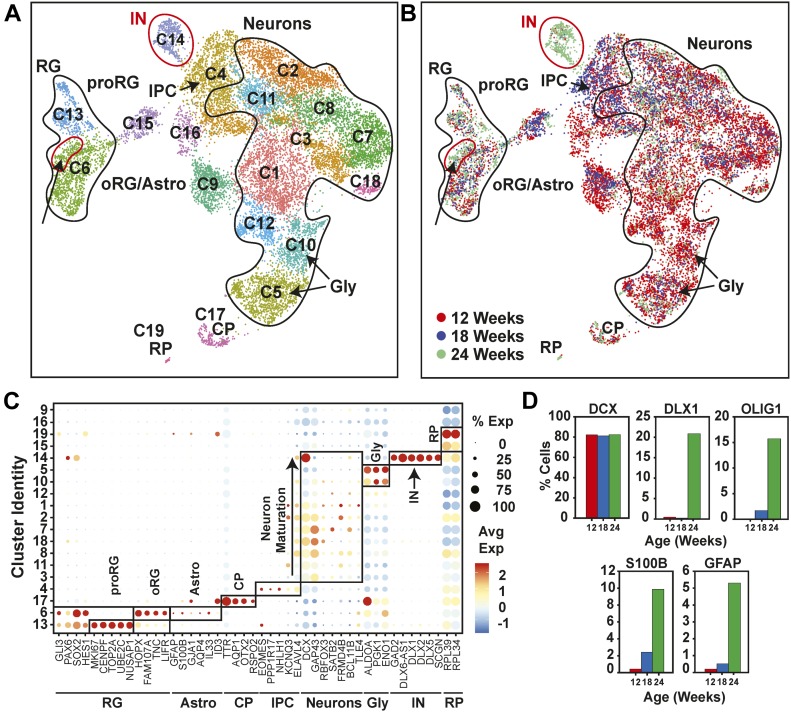
Figure 4. Characterization of cell type maturation in human cerebral organoids using single-cell RNA sequencing.
(A) Unsupervised clustering of combined single-cell RNA sequencing data from 12-, 18-, and 24-wk-old COs was visualized in Uniform Manifold Approximation and Projection plots. Cell types appearing at 24 wk, including interneurons (IN) in cluster 14 (red circle) and oligodendrocyte progenitors in oRG/astroglial cluster 6, (arrow and red circle) are marked. Cluster identities are indicated. (A, B) Uniform Manifold Approximation and Projection present in (A) segregated by time point. Cells from 12 wk depicted in red, blue for 18 wk, and green for 24 wk. (A, C) A dot blot indicates the expression of cell type–specific marker genes for all clusters in panel (A). The percent of cells expressing the gene (circle diameter) and the scaled average expression of the gene is indicated by the colour. (D) The percent of cells with expression of the indicated cell lineage markers, including DCX (neurons), S100B (mature astrocytes), GFAP (astroglia/astrocytes), DLX1 (interneurons), and OLIG1 (oligodendrocyte precursors) and at 12, 18, and 24 wk time points is plotted. Note the general neuronal marker DCX, which is expressed similarly across the time points, was used as a reference. CP, choroid plexus; GLY, glycolytic signature; IN, interneurons; IPC, intermediate progenitor cells; oRG, outer radial glial cells; proRG, proliferative radial glial; RG, radial glial cells; RP, ribosomal protein.

