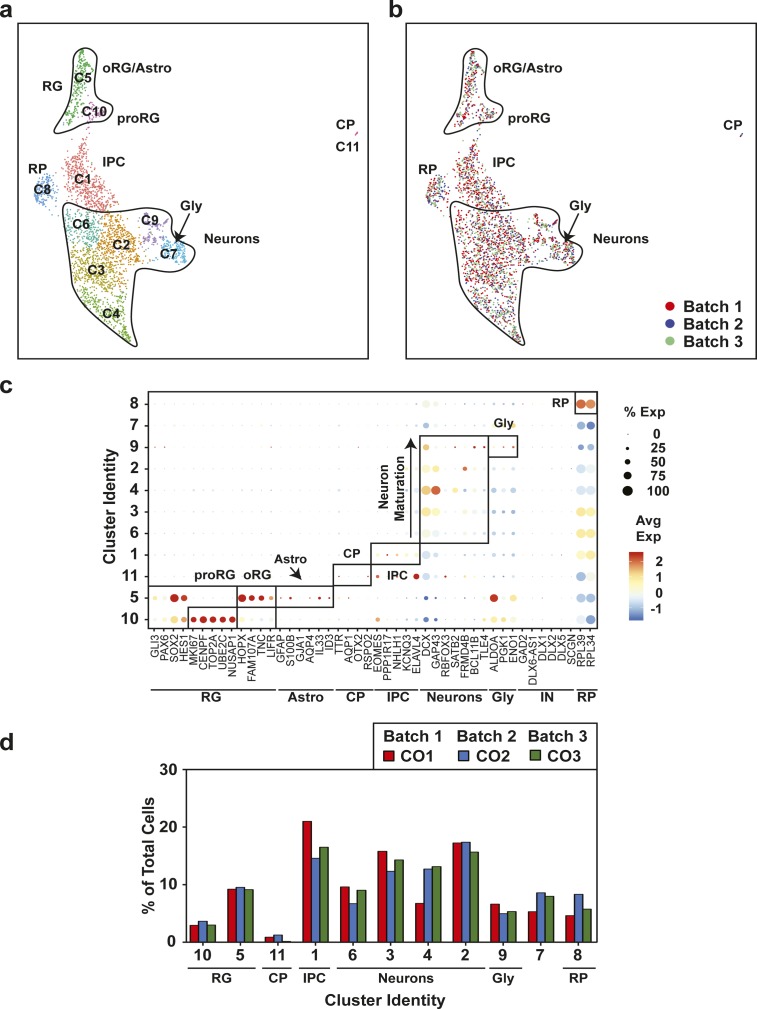
Figure S5. Uniform cell type composition in 18-wk-old human cerebral organoids (hCOs) is revealed by single-cell RNA sequencing.
(A) Uniform Manifold Approximation and Projection plots from unsupervised clustering of single-cell RNA sequencing data from three hCOs from three separate batches (CO1-CO3) (12,000 cells) are shown. Cluster identities are indicated. Emergence of an astrocyte population is observed in the oRG/astro cluster 10. (B) A dot blot indicates the expression of cell type–specific marker genes for all clusters. The percent of cells expressing the gene (circle diameter) and the scaled average expression of the gene is indicated by the colour. (C) Cluster frequency analysis depicting the percentage of cells in each individual organoid that contributed to each cluster. (A, D) Individual hCOs (CO1-CO3) are plotted in the Uniform Manifold Approximation and Projection axis defined in panel (A). CP, choroid plexus; GLY, glycolytic signature; IPC, intermediate progenitor cells; oRG/astro, outer radial glial cells/astroglia; proRG, proliferative radial glial; RG, radial glial cells; RP, ribosomal protein.

