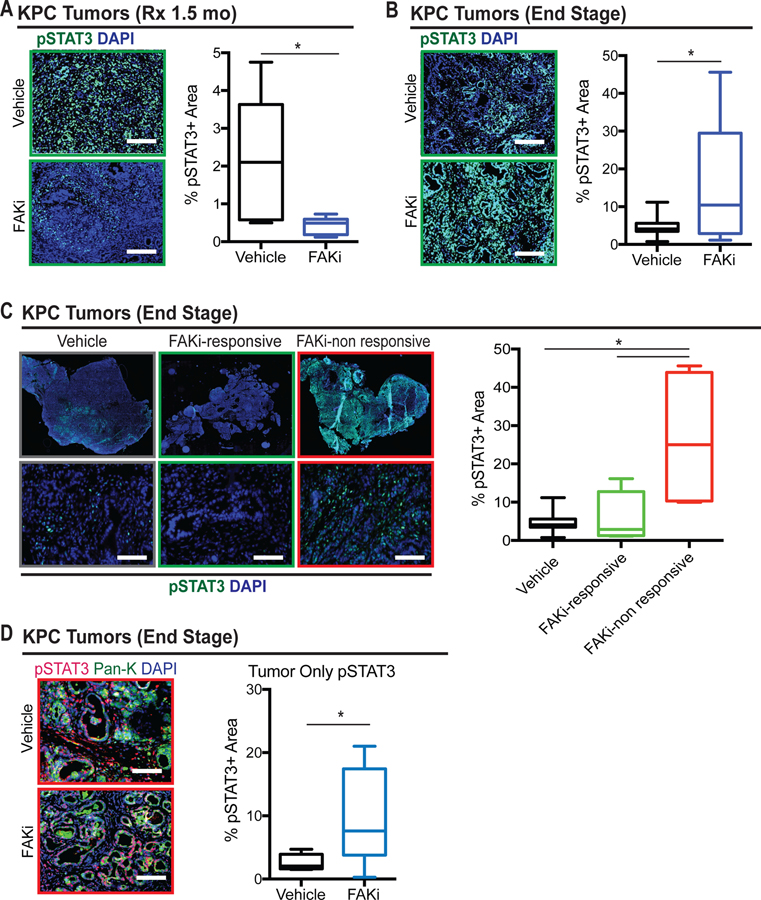
Figure 1. Elevated expression of pSTAT3 in end-stage FAKi-treated tumors.
(A) Representative immunofluorescence staining for pSTAT3 in PDAC tissue from 1.5-month vehicle-and FAKi-treated KPC mice. Scale bar, 100 µm. Right, the percentage of pSTAT3+ area for each treatment group (n = 5–6 mice per group). Error bars represent mean ± s.e.m. *P < 0.05 by Student’s t-test.
(B) Representative immunofluorescence staining for pSTAT3 in PDAC tissue from end-stage vehicle-and FAKi-treated KPC mice. Scale bar, 100 µm. Right, the percentage of pSTAT3+ area for each treatment group (n = 8–11 mice per group). Error bars represent mean ± s.e.m. *P < 0.05 by Student’s t-test.
(C) Representative whole-tissue and 10× inset of immunofluorescence staining for pSTAT3 in PDAC tissue from end-stage vehicle- and FAKi-treated (responsive and non-responsive) KPC mice. Scale bar, 100 µm. Right, the percentage of pSTAT3+ area for each treatment group (n = 5–8 mice per group). Error bars represent mean ± s.e.m. *P < 0.05 by Student’s t-test.
(D) Representative immunofluorescence staining for pSTAT3 and tumor marker pan-keratin (Pan-K) in tumor from end-stage vehicle- and FAKi-treated KPC mice. Scale bar, 50 µm. Right, the percentage of pSTAT3+ area in tumor from each treatment group (n = 7 mice per group). Error bars represent mean s.e.m. *P < 0.05 by Student’s t-test.

