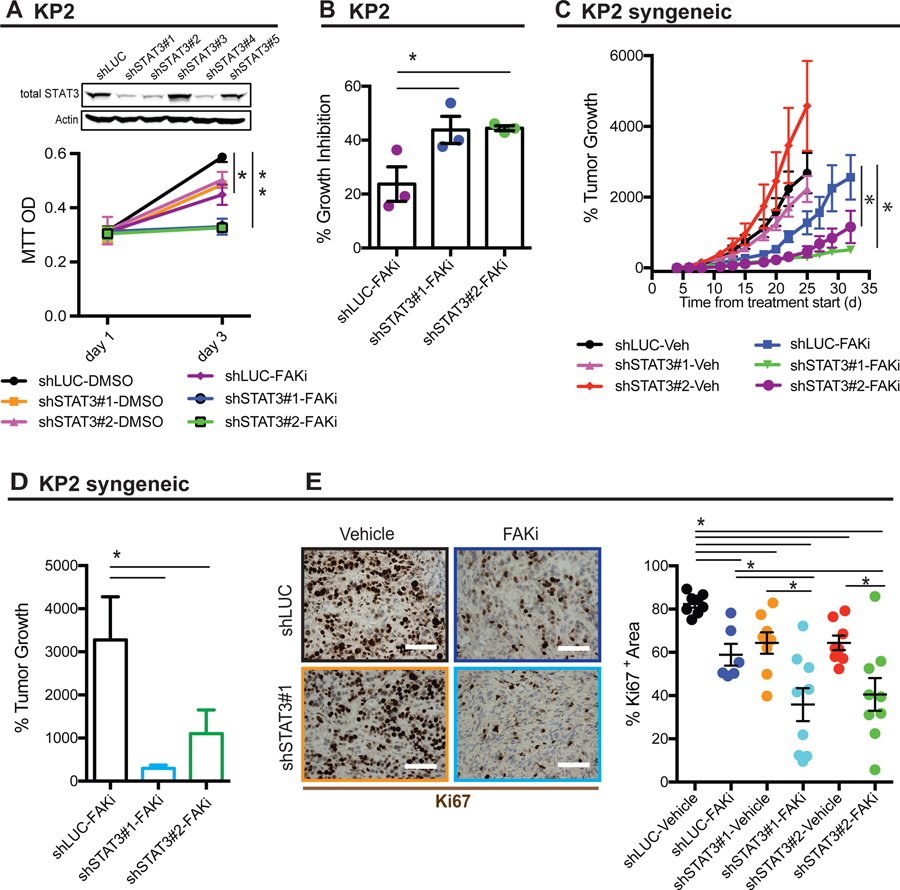
Figure 2. Tumor-intrinsic STAT3 contributes to FAKi response.
(A) Representative immunoblot for total STAT3 and β-actin (loading control) in KP cells stably expressing control shRNA (shLUC) or shSTAT3 constructs (shSTAT3#1, 2, 3, 4, and 5). Bottom, MTT proliferation assay using KP cells stably expressing shLUC or shSTAT3 constructs (shSTAT3#1 and 2) treated with DMSO or 1 µM FAKi. Error bars represent mean ± s.e.m. *P < 0.05 by Student’s t-test.
(B) Histogram showing the percentage of growth inhibition in KP cells stably expressing shLUC or shSTAT3 constructs (shSTAT3#1 and 2) treated with DMSO or 1 µM FAKi. Error bars represent mean ± s.e.m. *P < 0.05 by Student’s t-test.
(C) Syngeneic tumor growth of KP cells stably expressing shLUC or shSTAT3 in mice treated with vehicle or 50 mg/kg FAKi. All animal experiments included 8–9 mice per group unless otherwise specified. Error bars represent mean ± s.e.m. *P < 0.05; by one-way ANOVA with Dunnett’s multiple-comparison test.
(D) Histogram showing the percentage of tumor growth KP cells stably expressing shLUC or shSTAT3 in mice treated with vehicle or 50 mg/kg FAKi. Error bars represent mean ± s.e.m. *P < 0.05 by Student’s t-test.
(E) Representative immunohistochemistry staining for pSTAT3 in PDAC tissues from C57BL/6 mice subcutaneously transplanted with 200,000 KP cells stably expressing shLUC or shSTAT3 constructs (shSTAT3#1 and 2) and then treated with FAKi or vehicle. Scale bar, 100 µm. Right, the percentage of pSTAT3+ area for each treatment group (n = 6–9 mice per group). Error bars represent mean ± s.e.m. *P < 0.05 by Student’s t-test

