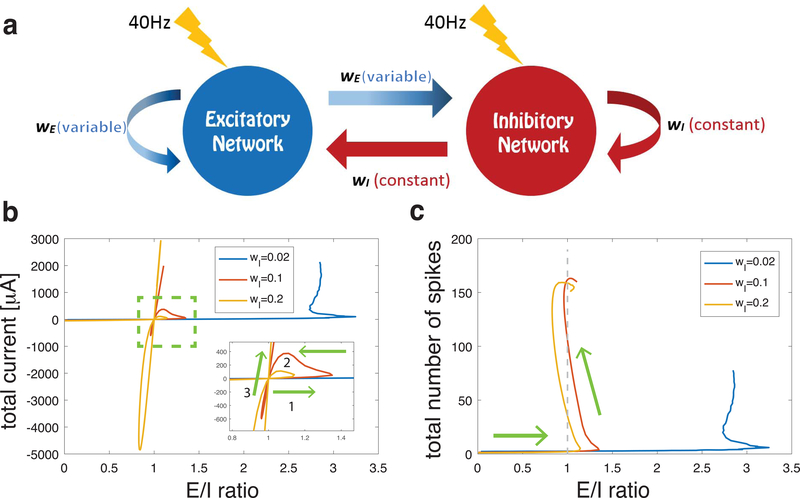
Figure 1.
(a) Schematic of network structure illustrating synaptic interactions from inhibitory cells (red) with fixed synaptic weight wI and from excitatory cells (blue) with varied synaptic weight wE. Lightning bolts represent the external noisy stimuli with average frequency 40 Hz applied to each neuron in the network. (b) Relationship between E/I ratio values and E-I current difference (total current) values in asymptotic balance states as excitatory synaptic weight wE was monotonically increased (arrows show direction of relative change with increasing wE). Four trajectory curves correspond to 4 values of inhibitory synaptic weight wI (given in legend in mS/cm2). Inset in panel b shows a close-up of the asymptotic E=I balanced state (i.e. when E/I ratio is near 1 and total current is near 0) with two trajectories (violet and yellow) that crossed this balanced state 3 times. (c) Trajectory curves of E/I ratio values and network spiking activity values (in Hz computed during the 1.5s simulation in the asymptotic balance state), as excitatory synaptic weight wE was systematically increased for the 4 values of wI (arrows show direction of change with increasing wE). For two trajectories (violet and yellow) although the E/I ratio oscillated above and below 1, spiking rates continued to increase as wE was increased.

