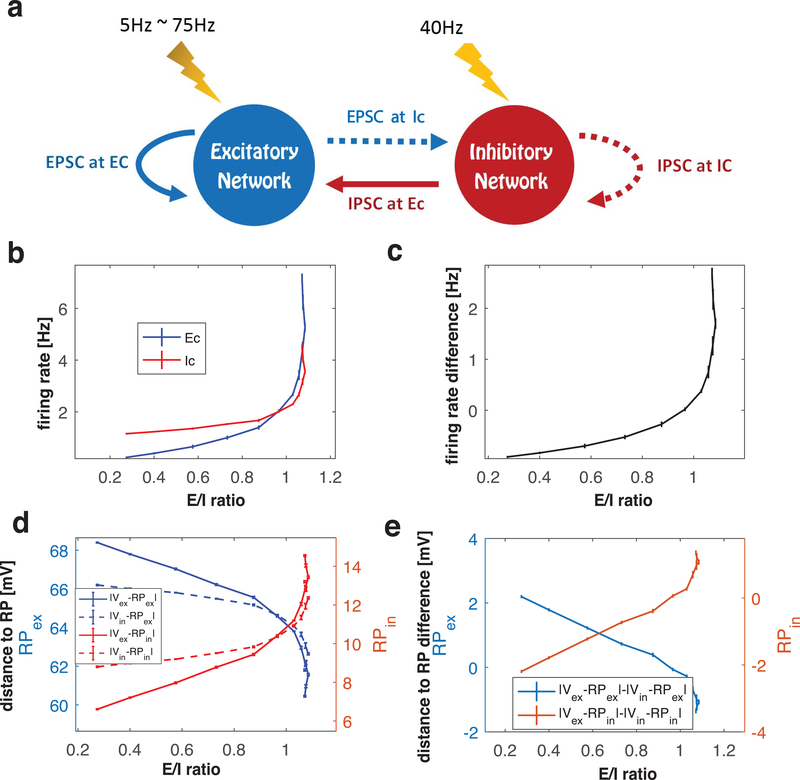
Figure 4.
Analysis of network factors contributing to E/I balance at the first crossing of the E=I balanced state. (a) Schematic of alternate method to change E/I ratio. Synaptic weights are fixed near the E=I balanced state and frequency of noisy external stimuli to the excitatory (E) cells is varied (see text for details). (b) Relationship between E/I ratio values and mean firing rates of the excitatory (E, blue curve) and inhibitory (I, red curve) cell populations as noise event frequency to the E cells is increased. (c) Difference between blue and red curves in (b). (d) Relationship between E/I ratio values and the difference between the mean membrane potentials of the excitatory () and inhibitory () cell populations, and the reversal potentials of the excitatory () and inhibitory () synaptic currents as noisy event frequency to the E cells is increased. Blue (red) curves show distances from . (e) Difference of distance curves shown in (d).

