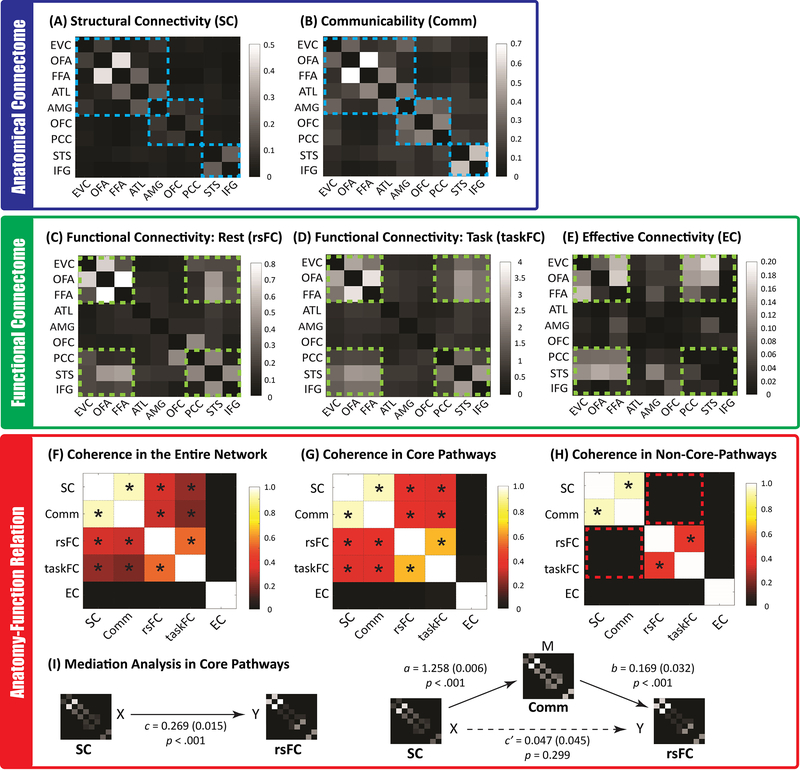
Figure 3. All Brain Connectivity Maps of the Face Network and Their Correspondence.
The top level blue box (A & B) depicts the anatomical connectome consisting of three core pathways/communities (highlighted in blue dashed lines). The middle level green box displays the functional brain connectivity patterns during rest or during the face localizer task. Most co-activations (C and D) and task-modulated brain dynamics (E was from PPI analyses) were observed among six face areas (i.e. EVC, OFA, FFA, PCC, STS, and IFG, which were highlighted in green dashed lines). The lower level red box shows the correspondence between different types of brain connectivity, either across the entire network or only within the three core pathways. Asterisks in (F), (G), and (H) denote significant positive correlations between two connectivity types. The results in (F) showed that the structural connectivity (SC) and communicability map (Comm) across the entire face network were highly correlated with functional connectivity maps (rsFC and taskFC), but the effective connectivity (EC) map was dissimilar with any of them, owing to its nature of reflecting asymmetrical and directional information processing during face perception. We further demonstrated that the tight anatomy-function relationship across the entire network was mainly driven by core pathways (G) because little evidence of such anatomy-function association was found outside of the core pathways (H) (the red dashed boxes represent the null anatomy-function correspondence). For simplicity, all maps from (A) to (H) were results from the right hemisphere. The left hemisphere yielded a very similar pattern of correspondence and can be found in Supplementary Figure 5. Finally, mediation analyses revealed (I) the network communicability functions as mediator for the association between anatomical and functional connectivity. This mediator role was only found in the core pathways (but no evidence for the entire face network). Numbers in the bracket indicate the standard error of the coefficient in each mediation model.

