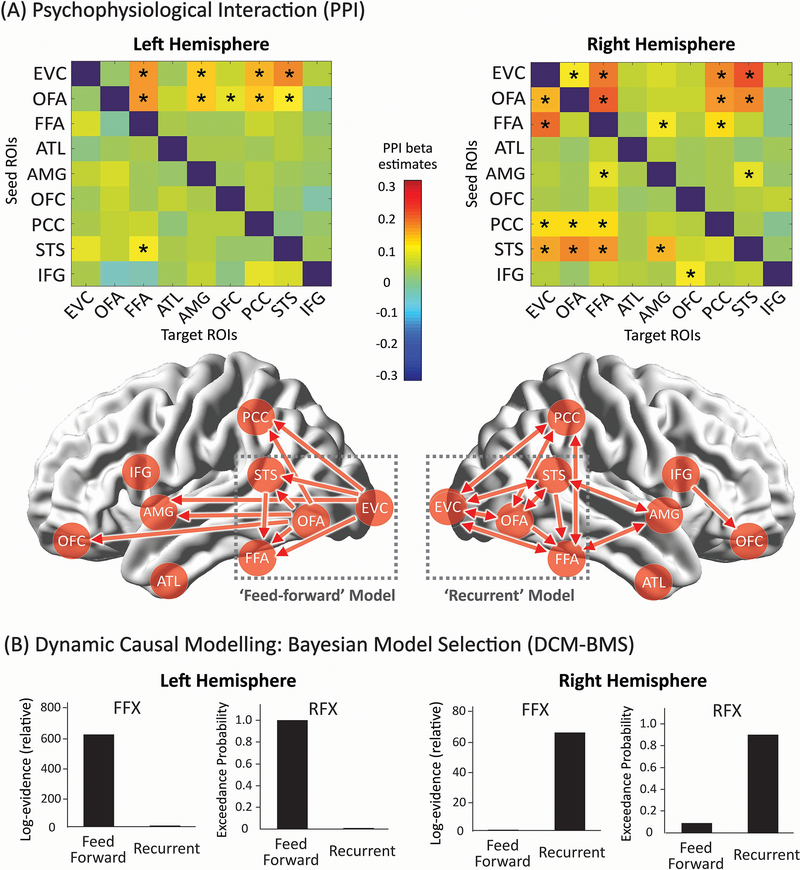
Figure 4. The Brain Dynamics within the Face Network during the Face Localizer Task.
(A) PPI results. The upper row shows the effective connectivity matrices for each hemisphere. Asterisks indicate statistically significant effective connectivity. The lower row is an illustration of all directional information flow summarized from the two effective connectivity matrices. Qualitatively, the two hemispheres exhibited entirely different patterns of brain dynamics. Only feed-forward information cascades were identified in the left hemisphere while both feed-forward and feed-back processing were found in the right hemisphere. To further validate these PPI findings, we built two DCM models (i.e. feedforward vs recurrent) and tested their respective fitness to the observed data in each hemisphere. As the most powerful applications of DCM have used networks with relatively small number of nodes and relatively simple model space motivated by priori knowledge, the two DCM models were constructed with four core face areas interacting the same way as they exhibited in PPI results (i.e. two dash-line grey boxes). For more details of model specifications as well as additional exploratory analysis on larger model space, please check Extended Data Figure 2. (B) DCM Bayesian model selection results. The fixed-effects (FFX) and random-effects (RFX) group analyses consistently indicated that the ‘Feedforward’ model was optimal for the left hemisphere whereas the ‘Recurrent model’ was optimal for the right hemisphere. Overall, the effective connectivity analyses by PPI and DCM both suggested a differential pattern of face-evoked information processing across two hemispheres.

