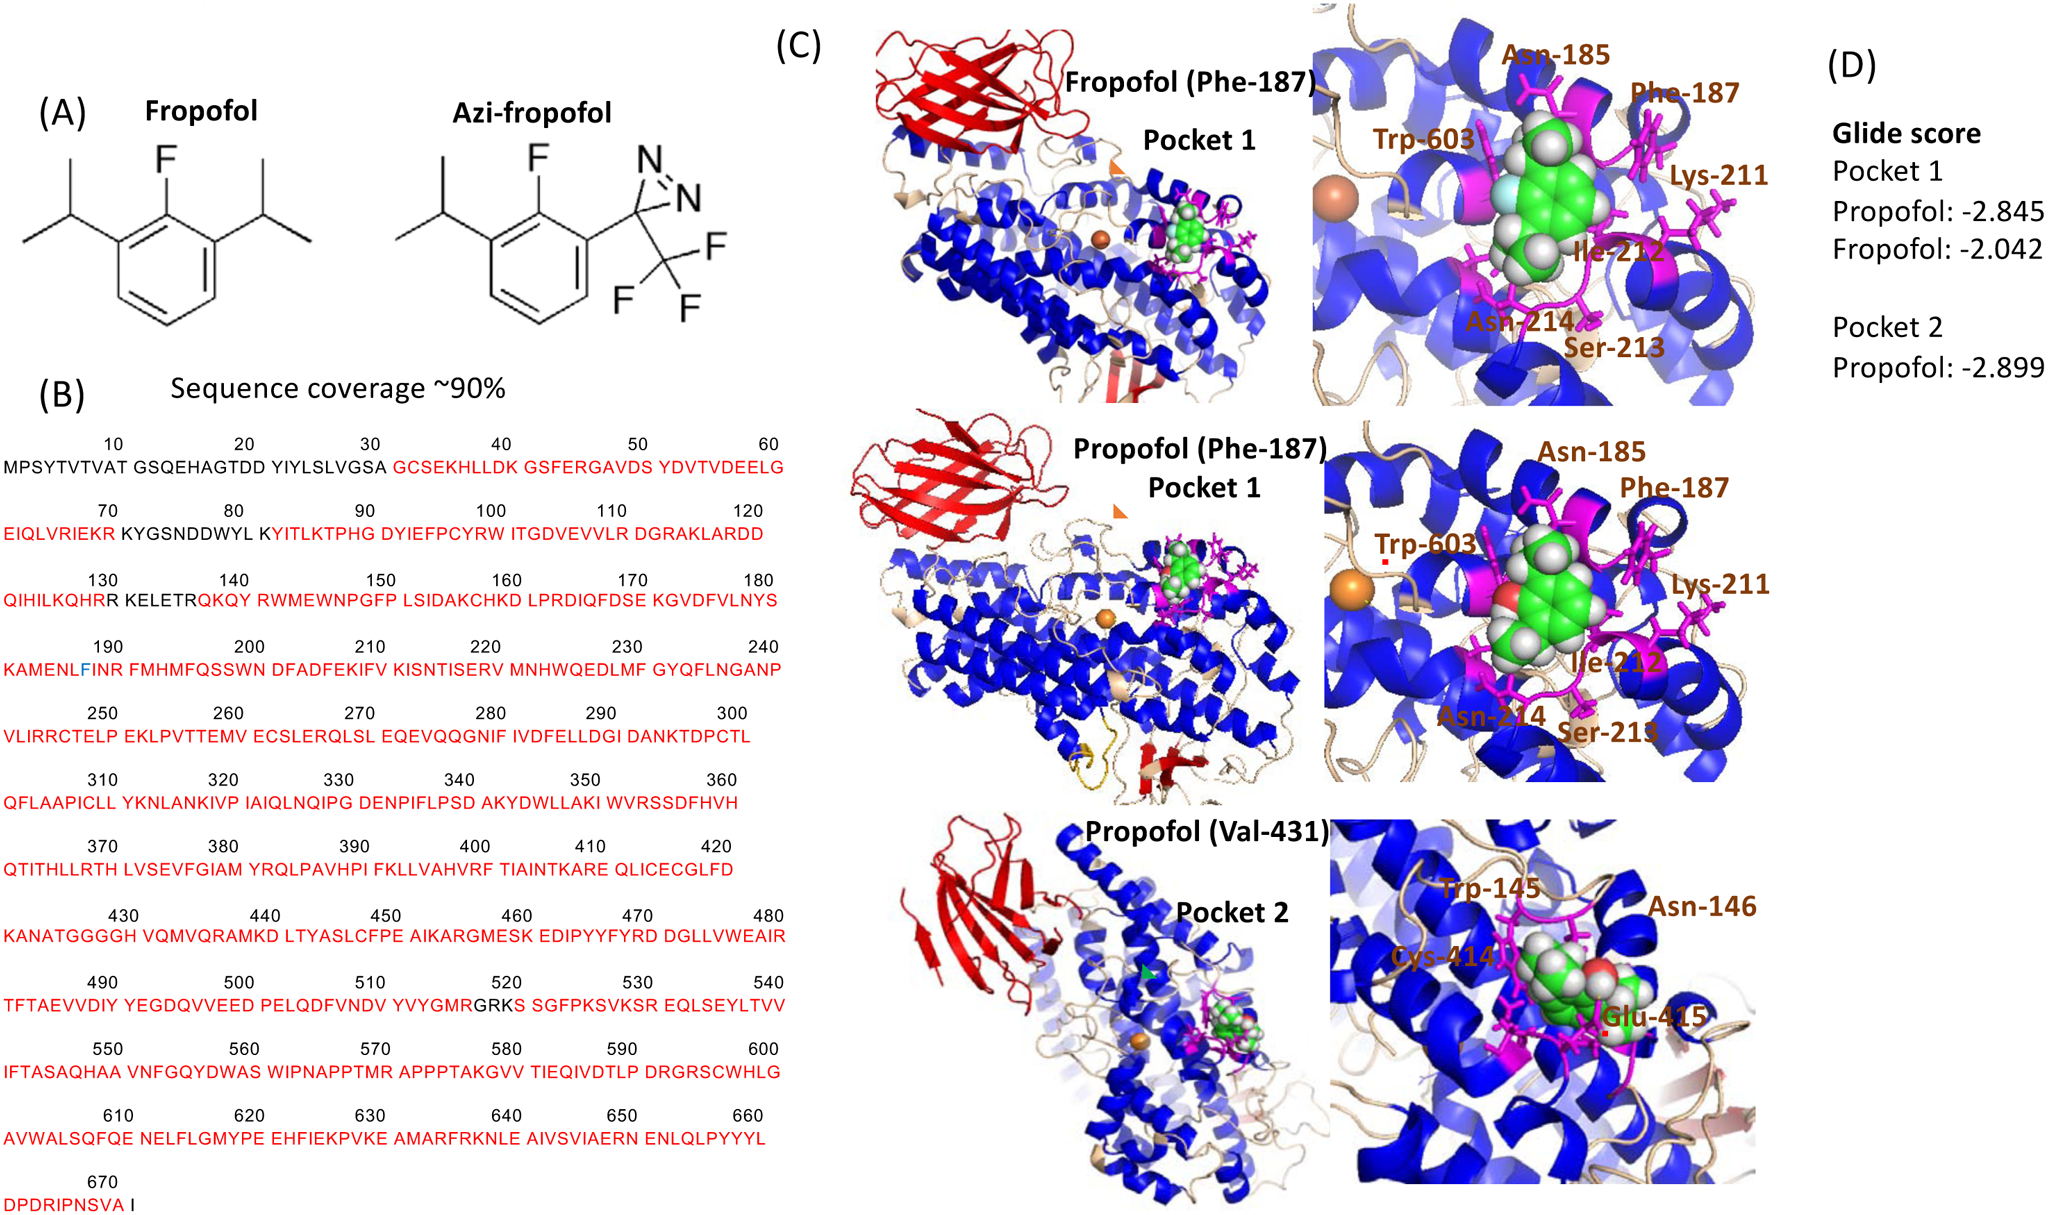
Figure 2. Photolabeling experiments of 5-lipoxygenase using azi-fropofol.

(A) Structure of fropofol and azi-fropofol.
(B) Photolabeling experiment was done as described in the Method. The adducted residue was shown in blue. Residues sequence-covered by mass spectrometry were shown in red.
(C) Rigid docking of propofol and fropofol. Blow-out images of docked sites were shown on the right. Red, blue and wheat colors showed beta-sheet, helix and loop, respectively. Gold sphere showed iron. Residues within 4 angstroms from the docked propofol or fropofol were shown in magenta. Red underlines indicate residues involved in hydrogen bond with propofol.
(D) Glide scores were shown.
