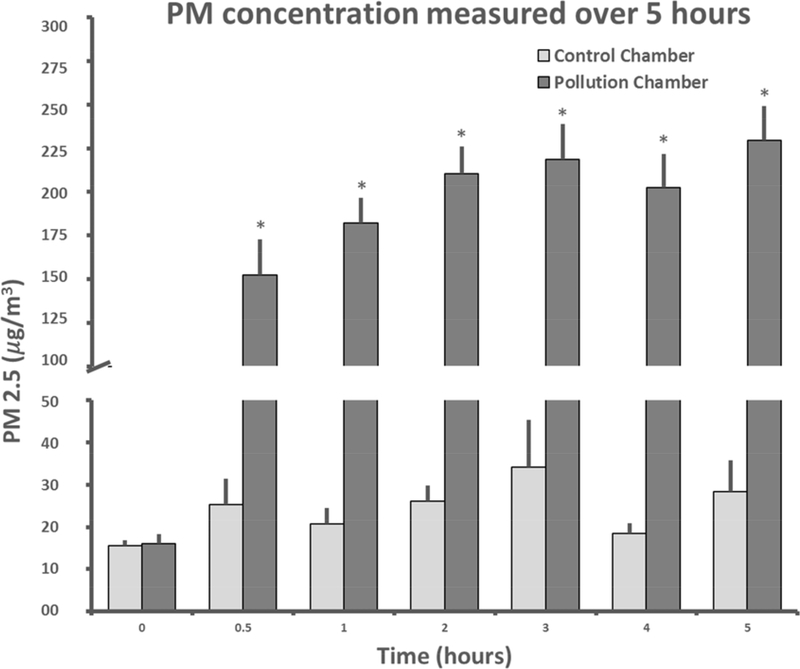
Figure 1.
PM2.5 Concentrations (mean ± standard error for all 29 exposure sessions) at seven time points in the control and exposure chambers. The fluctuation in control PM is due to the aperiodic/random nature of PM generation from rat locomotor and burrowing activity. * indicates that the exposure concentration was statistically significantly greater than the control concentration.

