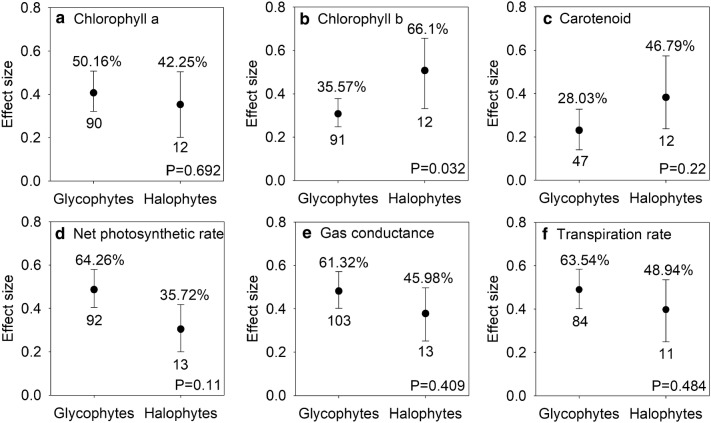
Fig. 5.
Responses to salt stress of chlorophyll a (a), chlorophyll b (b), carotenoid (c), net photosynthetic rate (d), stomatal conductance (e), and transpiration rate (f) in mycorrhizal halophytes and mycorrhizal glycophytes. Error bars represent 95% confidence intervals (CIs). Back-transformed effect sizes are shown above the bars. The numbers of studies are shown under the bars. Inoculation effects were considered significant when the 95% CIs did not overlap with zero. The P values for each panel reflect the significant differences between halophytes and glycophytes

