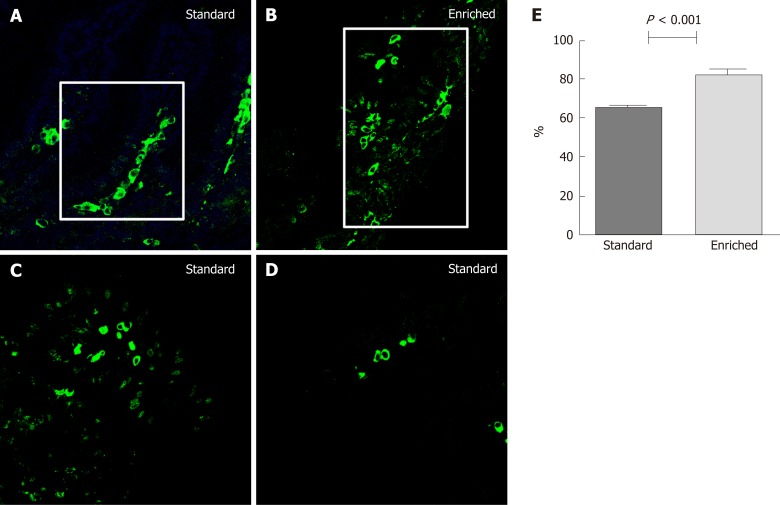
Figure 3.
The percentage of villous axis covered by the highest labeled cell at the 48th h after injection in normal mucosa. A, B: Percentage of villous area covered by the highest bromodeoxyuridine labeled cell at the 48th h after injection in normal colonic mucosa in standard (A) and enriched diet group (B); C, D: The pictures at 72th (C) and 96th (D) h in standard group is represented; the findings at these times were the same in the enriched diet group and limited to the tip of villi. Positive cells are stained green (confocal microscopy; magnification: 630 ×); E: Quantitative analysis.

