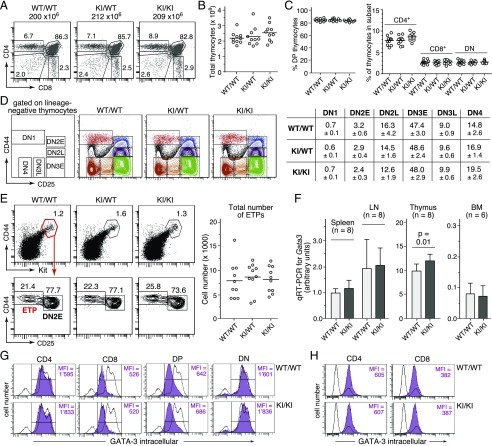
FIGURE 2.
Unaltered thymopoiesis and intact Gata3 expression in GATIR reporter mice. (A) Representative CD4/CD8 profiles of total thymocytes from wild-type (WT) (WT/WT), heterozygous (knock-in [KI]/WT) and homozygous (KI/KI) GATIR mice. The total number of thymocytes is given on top of each panel. Numbers in dot plots indicate the percentage of cells in the respective gate. (B) No difference in total number of thymocytes between Gata3 genotypes (n = 10 mice of each genotype). Unless stated otherwise in this and all subsequent figures, each circle represents data from one individual mouse. (C) No difference in thymic CD4/CD8 subset composition between Gata3 genotypes; double-positive (DP) (i.e., CD4+CD8+) thymocytes; double-negative (DN) (i.e., CD4−CD8−) thymocytes. (D) Unaltered DN subset composition in heterozygous and homozygous GATIR mice. Leftmost panel, Definition of gates based on CD25 and CD44 surface expression; dot plots, representative CD25/CD44 staining profiles from mice of all three genotypes. Cells were pregated on Lin− (negative for CD4, CD8α, CD11b, CD11c, CD19, Gr1, NK1.1, TCRβ, TCRγδ, and TER119). Table to the right, Average percentage of cells in respective gate ± SD (n = 10 per genotype). (E) The total number of ETPs, defined as Lin−, CD25−CD44+Kithigh thymocytes is unaffected in heterozygous and homozygous GATIR mice. Left panels, Representative flow cytometric staining profiles and gating strategy. Depicted cell populations were pregated on Lin− thymocytes (negative for same marker combination as in (D). Right, Total number of ETPs in thymi from all three Gata3 genotypes (n = 10). (F) Comparison of Gata3 transcript levels in unfractionated splenocytes, lymph node (LN) cells, thymocytes, and total BM cells isolated from homozygous GATIR and WT control mice. Total RNA was isolated from indicated cell populations, transcribed in cDNA, and quantified for Gata3 transcript levels by RT-qPCR relative to actin expression. The average expression level in WT splenocytes was arbitrarily set as 1 (n = number of independent cell samples from different mice that were assessed by RT-qPCR in triplicate). No statistically significant differences were observed in samples from spleen, LN, and BM. (G and H) Highly similar intracellular GATA-3 protein levels in CD4/CD8 thymocyte (G) and splenic T cell (H) subsets from homozygous GATIR and WT control mice, as determined by intracellular flow cytometry. Respective cell populations were defined by electronic gating on CD4/CD8 thymic cell subsets (G) and CD3+CD4+ or CD3+CD8+ splenocytes (H). Purple histograms: GATA-3 protein levels in electronically gated cell subsets. Open histogram overlays in (G): GATA-3 protein level in total thymocytes from the same mice but depleted for CD4-, CD8-, and CD3-expressing cells to increase the relative abundance of GATA-3–negative thymocytes and thus better document the specificity of the staining for thymocytes. Open histogram overlays in (H): GATA-3 protein levels in total splenocytes.

