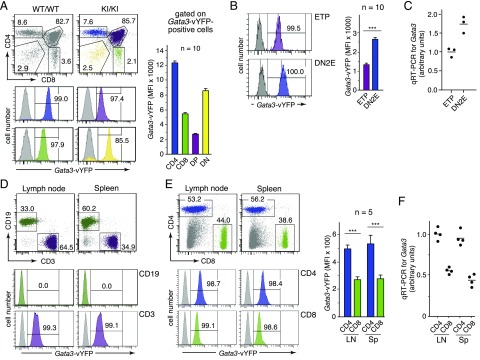
FIGURE 3.
Robust vYFP reporter-derived fluorescence levels faithfully reflect endogenous Gata3 expression. (A) Analysis of CD4/CD8 thymocyte subsets for vYFP reporter expression. Left panels, Representative profiles of reporter expression in thymic CD4/CD8 subpopulations. Dot plots on top show the gating strategy. Gray histograms correspond to respective thymocyte subsets from the wild-type control mouse. Bar graph: average mean fluorescent intensity (MFI) of vYFP reporter expression in respective thymocyte subsets from 10 homozygous GATIR mice. (B) Gata3-vYFP reporter expression in ETP and DN2E thymocyte subsets. Left panels, Representative histograms are shown. Electronic gates for sorting of ETP and DN2E cells were as shown in Fig. 2E. Gray histograms correspond to respective cell populations from a wild-type control mouse. Bar graph: Average MFI of vYFP reporter expression in ETP and DN2E thymocyte subsets from 10 homozygous GATIR mice. (C) Quantification of Gata3 transcript levels in wild-type ETP and DN2E cells by RT-qPCR relative to cyclophilin A expression. ETP and DN2E cells were obtained from pooled thymocytes of two wild-type mice in each of three separate FACS sorts. Electronic gates for sorting of ETP and DN2E cells were as shown in Fig. 2E. All cDNAs obtained from individual FACS sorts were then analyzed in triplicate in the same RT-qPCR amplification experiment. Hence, each circle corresponds to the average signal in the respective cell population (ETP or DN2E) from an individual FACS sort. The average signal intensity for ETPs was arbitrarily set as 1. (D) Representative histograms of vYFP reporter expression in gated B (CD19+; green) and T lymphocytes (CD3+; purple) from lymph node (LN) and spleen (Sp). Dot plots on top show gating strategy. Gray histograms correspond to the respective cell population from a wild-type mouse. (E) Gata3-vYFP reporter expression in CD4+ and CD8+ T cell populations from lymph node and spleen. Left panels, Representative profiles of vYFP reporter expression in indicated T cell subsets. Dot plots on top show gating strategy. All cells shown are pregated on CD3-positive cells. Gray histograms correspond to the respective cell population from a wild-type mouse. Bar graph: average MFI of vYFP reporter expression in respective T cell subsets from five homozygous GATIR mice. (F) Quantification of Gata3 transcript levels in CD4+ and CD8+ T cell subsets FACS-sorted from LN and Sp of wild-type mice. Corresponding cell subsets from two mice were pooled in each of four independent FACS sorts. All cDNAs obtained from individual FACS sorts were then analyzed in triplicate in the same RT-qPCR amplification experiment relative to actin expression. Hence, each circle corresponds to the average signal in the respective cell population from an individual FACS sort. The average signal intensity for splenic CD4+ T cells was arbitrarily set as 1. ***p < 0.001.

