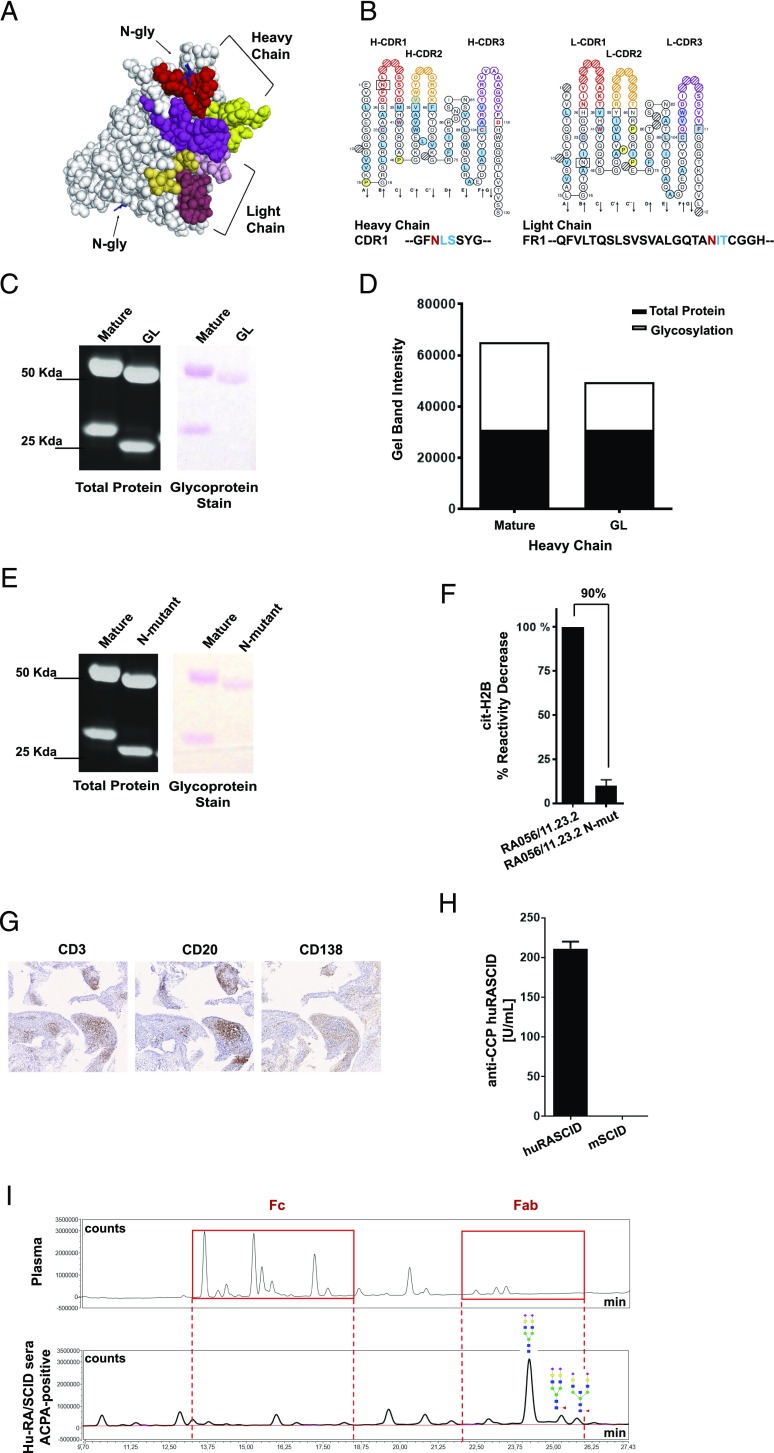
FIGURE 3.
Importance of SHM for Fab N-linked glycosylation in RA056/11.23.2. (A) three-dimensional structure prediction of the RA056/11.23.2 rmAb showing the N-glycosylation sites in the V region. CDR regions are shown in color. (B) ImMunoGeneTics Collier de Perles (19) of the RA056/11.23.2 rmAb showing the position of the N-glycosylation consensus sequence in the HC-CDR1 and LC-framework region 1 (LC-FR1). (C) SDS-polyacrylamide gel showing both total protein and glycoprotein staining of the RA056/11.23.2 rmAb. The residual glycoproteins observed in the HC is due to the Fc-glycosylation of the RA-rmAb. HC molecular mass = 50 kDa; LC molecular mass = 25 kDa. Glycans appear as magenta bands. (D) Densitometry analysis of the glycoprotein staining. (E) SDS-polyacrylamide gel showing both total protein and glycoprotein staining of the N-mutant RA056/11.23.2. (F) Binding of the N-mutant RA056/11.23.2 to cit-H2B tested by ELISA. Results are expressed as percentage in reactivity decrease compared with the mature clone. Number on top of the graph indicates the percentage of decrease reactivity. (G) Representative pictures of ELS+ RA synovial tissue (transplanted into SCID mice) paraffin-embedded sections stained for CD3 (T cells), CD20 (B cells) and CD138 (plasma cells). Original magnification ×10. (H) Levels of circulating human ACPA-IgG measured by ELISA in the human RA/SCID mice. (I) UHPLC chromatograms of the N-glycans from human plasma (used as control; top spectra) and from ACPA+ SCID sera (bottom spectra) showing N-glycosylation in the Fab domain of ACPA-IgG isolated from SCID sera. Red boxes highlight the N-glycans in the Fc (left box) and Fab (right box).

