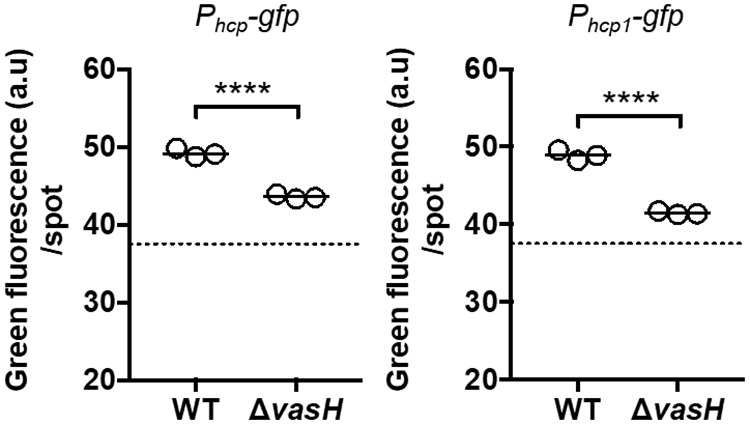
FIG 6.

Impact of VasH on hcp and hcp1 expression. Green fluorescence per spot of growth was measured for the indicated strains. Strains used in this experiment were FQ-A001 (WT) and KRG005 (ΔvasH) harboring either the pKRG001 (Phcp-gfp) or the pNPW15 (Phcp1-gfp) reporter plasmid. The dotted line represents the autofluorescence of a nonfluorescent sample. The promoter being tested in each experiment is indicated above the graph. Statistical differences between groups were determined using a t test; ****, P < 0.0001. Results shown are representative of two independent experiments. Results shown are from a representative trial of an experiment that was performed three times.
