FIG 4.
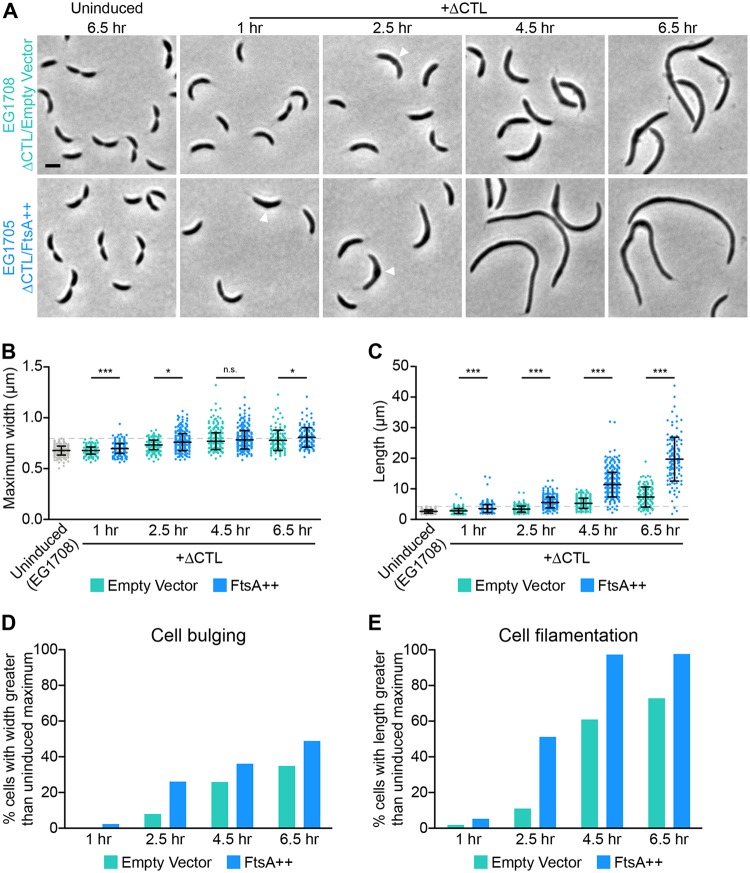
FtsA overproduction induces earlier bulge formation and greater filamentation in cells producing ΔCTL. (A) Phase-contrast images of cells uninduced or induced with xylose to drive expression of mNG-ΔCTL and empty vector (turquoise) or ftsA (blue) from PxylX promoter for the indicated amounts of time prior to imaging. Arrowheads indicate bulges at early time points. (B and C) Quantification of maximum width or length of cells from strains shown in panel A at indicated time points. The maximum value of the uninduced EG1708 strain is denoted by a dashed line in each. Bars represent standard deviations (n = 379 cells per strain for 1-, 2.5-, and 4.5-h induced and 6.5-h uninduced time points; n = 179 cells per strain for the 6.5-h induced time point). *, P ≤ 0.05; ***, P ≤ 0.001; n.s., not significant. (D and E) Proportions of cells from strains shown in panel A at indicated time points with maximum width (as a readout of bulging) or length (as a readout of filamentation) greater than that of the maximum value for uninduced cells of the same strain. Strains are as indicated, and all strains have xylose-inducible ΔCTL.

