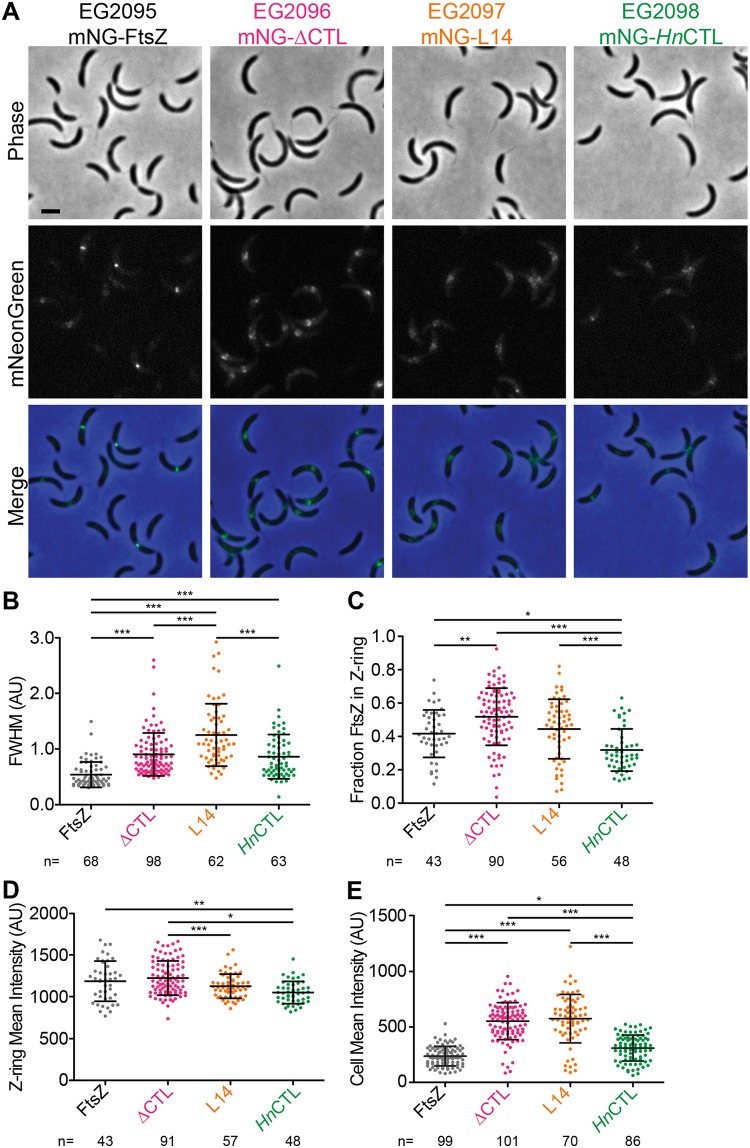
FIG 5.
ΔCTL assembles into large asymmetric superstructures at sites of cell wall bulging in cells depleted of WT FtsZ. (A) Phase-contrast, epifluorescence, and merged images of cells induced with xylose to drive expression of mNG-FtsZ, mNG-ΔCTL, mNG-L14, or mNG-HnCTL from the PxylX promoter for 1 h while simultaneously depleting WT FtsZ. Scale bar, 2 μm. (B to E) Quantification of epifluorescence images of cells 3 to 5 μm long indicating the full width at half-maximum (FWHM) values of Z-ring intensity (B), fraction of mNG-FtsZ or variants in the Z ring (C), and mean epifluorescence intensity of the whole cells (D) or the Z ring (E) in an FtsZ depletion background. Bars represent standard deviations. Numbers of cells per strain are indicated for each measurement. *, P ≤ 0.05; **, P ≤ 0.01; ***, P ≤ 0.001. Strains are indicated in panel A. AU, arbitrary units.

